Work in progress
This tutorial goes step by step through setting up a Trend Detection on a Squirro project and visualizing it on a Squirro dashboard.
Table of Contents
What is Trend Detection?
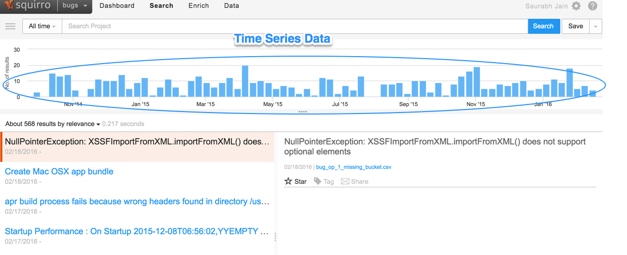
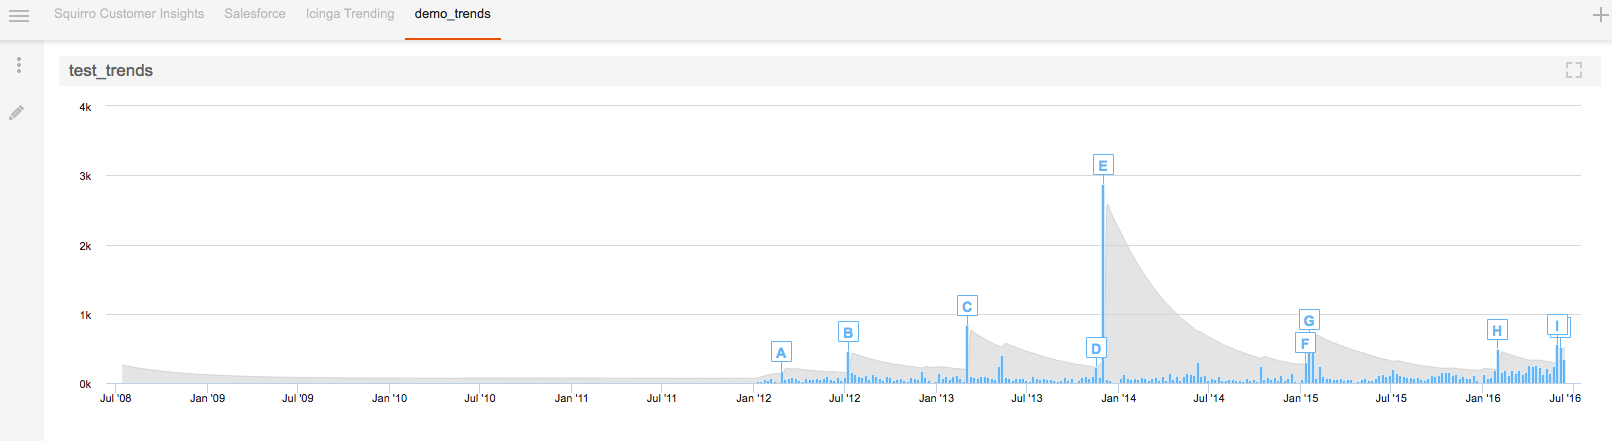
The Trend Detection analysis can be used to detect unusual trends in the time series data. In the Squirro context, time series data is generated in the form of the number-of-items per time-unit in a particular project for a particular query. This time series data can be easily observed today with the histogram bins on the search page (see image below). Trend detection analysis aims to find unusually high peaks in this histogram/time-series automatically.
As an example scenario, consider a project `News` with a feed of all the news-items from a few of the major news publications. Now, a query like `Facebook AND Whatsapp` will filter the list of all the documents to a sub-list of documents/news-items containing both the words Facebook and Whatsapp. For the project `News` with query `Facebook AND Whatsapp`, we define a time-series as the number of items matching `Facebook AND Whatsapp` per time-unit, where time-unit can be hourly, weekly, daily, monthly or yearly.
The detection of unusual trends is done by learning from the historical/old data to auto-compute a reasonable threshold. So, in order for it to work properly it is important that we have enough historical data to learn from.
As a rule of thumb, it is advisable to have at least two weeks worth of data.
Dataset Used
We are going to cover two different scenarios of setting up trend-detection and we are going to use two different datasets to demonstrate it.
In the first scenario, we will set up trend detection on the number of items arriving in the project over time. For this scenario, we are going to use the bug-tracking dataset from the bugtrackers. We have removed the summary of the bugs to reduce the size of the csv file for import. Please download this dataset from here if you want to follow along with the tutorial.
In the second scenario, we will set up trend detection on change in the values of numerical facet of a Squirro item over time. For this scenario, we are going to use an anonymized ITSM dataset. Please download the csv dataset from here if you want to follow along with the tutorial. Every row in the dataset contains three fields i.e. "date", "title" and "calls". Please note that this dataset does not contain any textual data because trend-analysis is done purely on numerical data.
Scenario 1 - Trend Detection analysis on item counts
This section guides one through the process of setting up Trend Detection on the item counts in a Squirro project over time. Furthermore, these item counts can also be filtered with a Squirro Query as filtering step before setting up the Trend Detection analysis. Both of these use-cases are covered in the subsequent subsections below.
Importing data into Squirro Project
pass
Trend Detection without query
- On the "Search" tab of Squirro UI, select the "Create Trend" option from the "Save" button drop down.
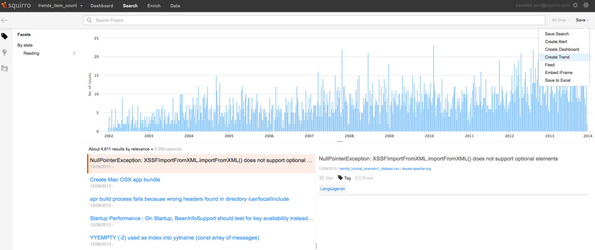
- This will present the user with a "Create Trend" modal, which needs to be filled with the necessary information described below.
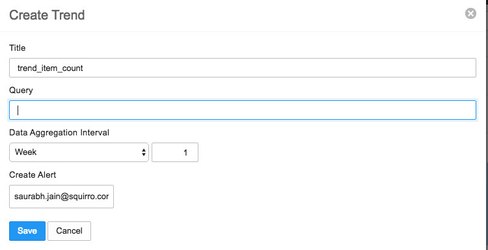
where,- Title: is the name of the name of the trend-detection you are setting up.
- Query: is an optional Squirro Query which will be used to filter down the item-counts.
- Data Aggregation Interval: is the length (in time units) of one time bucket.
- Create Alert: is the email-address for sending alert emails whenever something unusual is detected
- Click on the "Save" button to complete setting up the Trend-Detection.
Visualization using Trend widget
Trend-Detection with query
pass
Visualization using Trend widget
Scenario 2 - Trend Detection analysis on numerical facets
set up Trend Detection on numerical facet
- One can also use the "Create Trend" modal to create a new trend detection on a numerical facet.
- In the presence of a numerical facet, the "Create Trend" dialog will have an extra checkbox to set up the trend detection on a numerical facet rather than the item counts
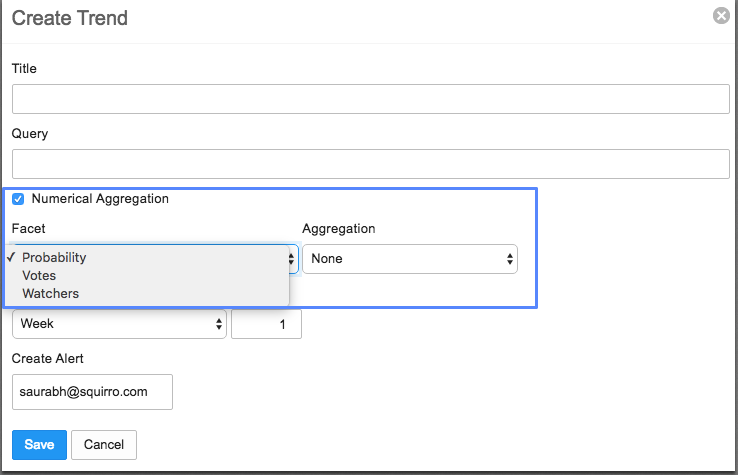
- Using this "Numerical Aggregation" checkbox, one can select a particular numerical facet of interest.
- Once a numerical facet has been selected, one can choose the aggregation method to be used on the numerical facet before setting up the trend detection. Possible options for aggregation are: Sum, Average, and Minimum.
- The rest of the workflow for setting up the Trend Detection is similar to the workflow for setting up the Trend Detection on the item-counts.
visualizations
A Trends widget on the dashboard first requires a Trend-Detection to be set up first using the "Search" tab of Squirro.
- Once set up, the detected anomalies can be visualized on the dashboard using a new "Trends widget" on the dashboard.
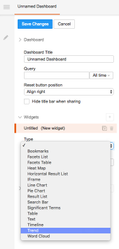
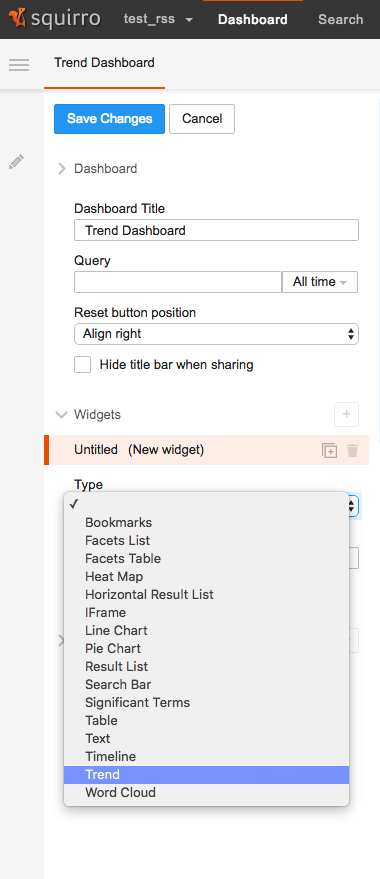
- One can select the "Trends" widget under the dashboard edit mode by adding a new widget of type "Trend" as show in the screenshot below.
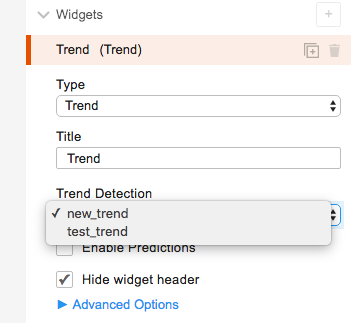
- Once selected, one can choose between all the trend detections set up on the project as shown in the screenshot below, where one can select between two different trend-detections.
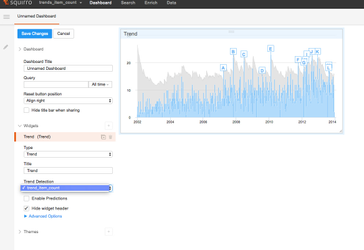
- Once selected, one can see the visualizations on the Trend widget as shown below
Conclusion
The two examples in this tutorial led you through two main scenarios for using Trend-Detection
- Setting up Trend Detection on the item counts over time in a Squirro project.
- Setting up Trend Detection on the values of numerical facets over time in a Squirro project.
Consult the Trend Detection reference for reference or contact support if you have any questions about how to do something specific with the Trend Detection.