The Squirro Dashboard allows configuration of various data visualisations, basing on the current project and dataset.
The following widgets, each with its own visualisation, are available to configure inside the Dashboard:
- Pie Chart
The Pie Chart can be used to display values of a specific facet in a pie format, with legend.
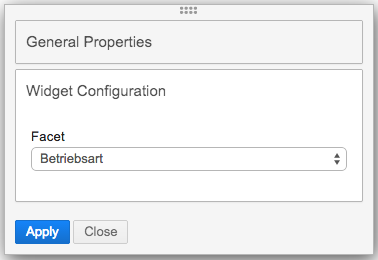
The only configuration required is the facet, which values will be populated on the chart.
- Cloud Chart
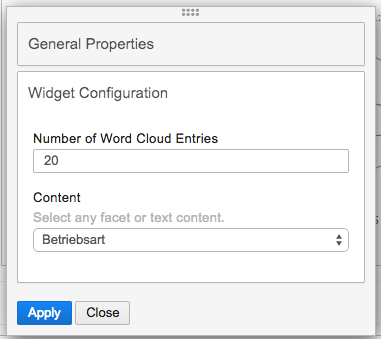
The Cloud chart is capable of displaying values of several (between 1 and 6) different facets at once.
Each facet can be assigned a color in which it shall be displayed on the chart.
- Line Chart
The Line chart displays facet values of one facet in the form of a time based line chart.
This is be particularly useful if the dataset contains dates in one of the facets.
The only configuration required is to provide a facet to display on the chart.
- Keywords
The Keywords list displays the top keywords for a facet, in a list format, with the number of matches in analysed documents, aswell as percentage based part of the set they represent.
To configure, one is asked to provide a facet which values to display on the chart.
- Significant Terms
The Significant Terms provides visual information about terms which are especially significant in a dataset, comparing to another dataset.
More in-depth explanation and usage examples later on this page, in the Configuration section.
- Frequency
- Result List
The Result List widget simply displays a list of results, as seen on the Search page. Clicking on a result will show its content in a pop-up window.
No configuration is neccesary for this widget.
- iFrame
The iFrame widget allows embedding websites into the Squirro Dashboard. The configuration has one parameter only, the URL.
In order to embed a website as an iFrame, it must itself support that via X-Frame-Options, aswell as being served via the same protocol as Squirro itself (http / https).
The URL must be well formatted, including the protocol (eg. http://www.squirro.com).
There are several parameters in the URL that one can use to extend the functionality. Using those optional parameters allows a limited channel of communication to be created between Squirro and the embedded webpage.
- %s - will be replaced by the current Dashboard query when resolving the URL.
- %tb - will be replaced by the beginning of the current Dashboard time range (if one is defined).
- %ta - will be replaced by the end of the current Dashboard time range (if one is defined).
Dashboard configuration
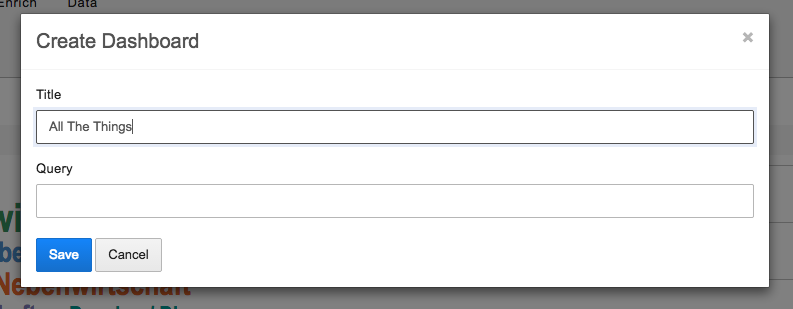
To configure a dashboard, it has to be created first.
Directly after creation, the user is presented with a fresh dashboard, an empty widget and a configuration panel for it.
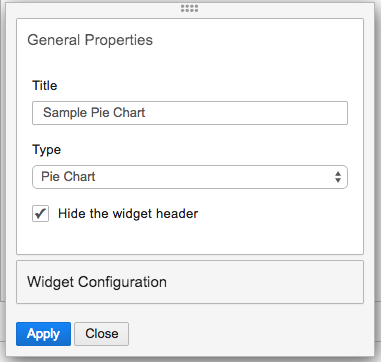
The panel is divided into two sections, 'General Properties', which is shared by all widgets, and 'Widget Configuration' which contains the configurable parameters for this widget type, which is currently chosen in 'General Properties' section. To switch between the sections, just click on their titles. The panel is completely draggable, so feel free to position it wherever is more convenient for the task at hand.
We will proceed to configure a Pie Chart widget now.
Pressing Apply will save the widget and show it in its designated spot. The widgets themselves can be moved around too, and they mind the other widgets already in place, ensuring all are visible at any given time. Changing different settings, widget types, and applying the changes, will make them visible straight away, without closing the configurator. That allows to pick and choose until the tool most suitable for the task at hand is found.
Widgets can also be configured as having their headers hidden. That way, the header will only be visible in the edit mode, and even then, it will not obscure the actual widget view, allowing to see instantly how a particular widget configuration would look like.
NOTE: When editing an existing Dashboard, pressing Apply on the widget configurator will not actually perform a save on the dashboard itself. To save a dashboard, the user is expected to press Save at the bottom of the page. This differs from the handling on Search page, where all the widgets and their dashboard are saved automatically on every Apply (speaking broader, every change, so for example moving widgets around will cause a dashboard save too). The same auto-save mechanism is used when the edited widget is the first one in a newly created dashboard. In this case applying the widget will save it, save the dashboard and reload the page.
And that's how this Pie Chart widget looks after configuration.
The videos below demonstrate the creation of a simple dashboard in practice.
Significant Terms configuration
Significant Terms allow to reveal the uncommonly common. This means, that it shows which terms show a significant different value distribution in a foreground-dataset when compared to a background-dataset. This requires a certain amount of documents to work, the more terms there are in a facet, the more document are needed to get a meaningful answer. In Squirro the background-dataset is what is defined in an unmodified dashboard. The foreground-dataset is constructed from the background-dataset and includes the current selection. If there is no selection, meaning that the foreground- and the background-dataset are equal, the term frequency is shown (except if the facet is body, title or summary where this operation is too costly).
Significant terms work very well on facets with few values, meaning if computed on a body, title or summary field, there are much more documents needed to get a significant term to show-up. One workaround for this restriction is to use phrase- or term detection and index those phrases/terms in a separate facet field. This has shown to improve the results vastly while also not requiring a lot of documents.
The following screenshot shows the significant terms on the left, without any selection:
The Significant Terms configuration is easy for facet content fields, and looks like this:
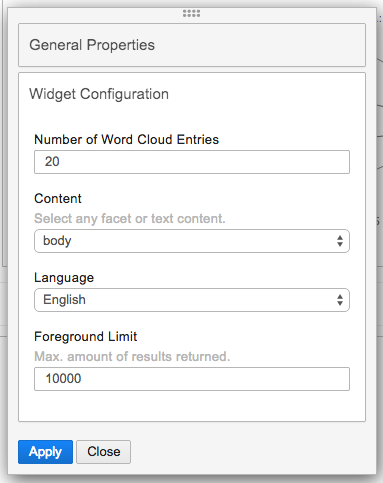
When configuring over a special content field (body, title, summary), one is asked also to provide language and the maximum number of results returned.
The maximum number of results field affects performance, so exercise caution when increasing the limit.


.png?version=1&modificationDate=1418903584252&cacheVersion=1&api=v2&width=758&height=250)


