Skip to end of metadata
Go to start of metadata
You are viewing an old version of this page. View the current version.
Compare with Current
View Page History
Version 1
Current »
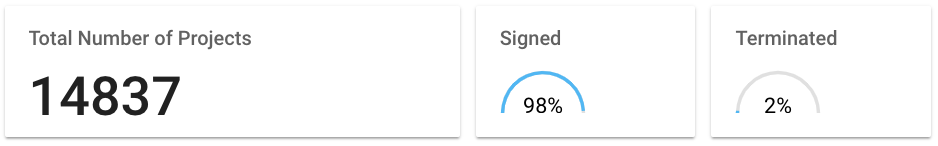
- Metrics widget can be used to display the count of a single metric to create high level summary of the dashboard. Example: No. of incidents reported.
- The widget needs to be configured by a 'Base Query', which is the query behind a particular metric.
- To see the percentage contribution of one metric over the other, both the 'Base Query' and the 'Sub Query' need to be defined. Example: Percentage of tickets closed out of total tickets.
- The percentage contribution is displayed using the percentage gauge variation of the widget.