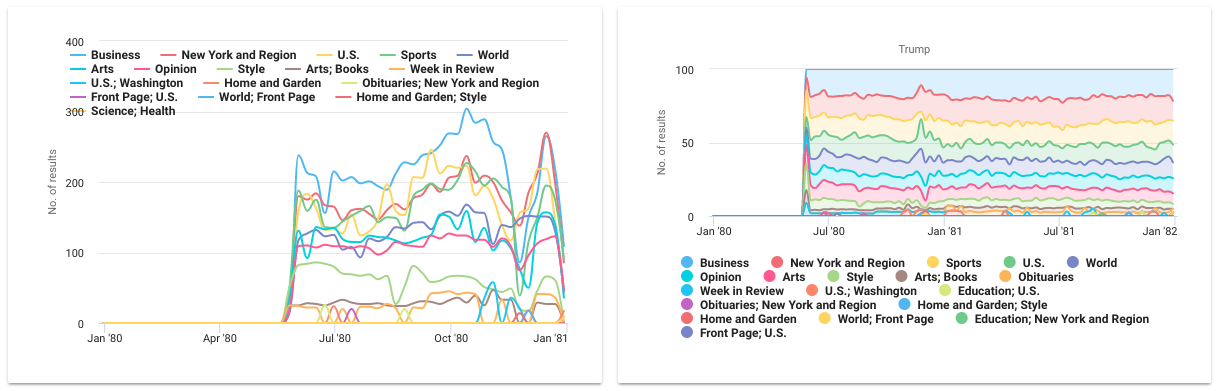
- The Line chart displays facet values of one facet in the form of a time based line chart.
- This is be particularly useful if the dataset contains dates in one of the facets.
- The only configuration required is to provide a facet to display on the chart.