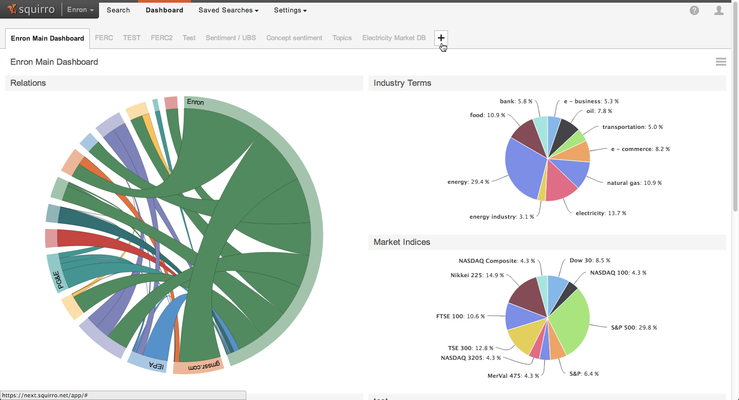
Dashboards are visual representations of data. Squirro supports extensive dashboarding functions, allowing you to have real-time visual representations of data as you search.
Table of Contents
Creating dashboards
To create a dashboard,
- Open the Dashboard page by clicking on
Dashboardin the top menu. - Click on the + sign at the end of the list of existing dashboards.
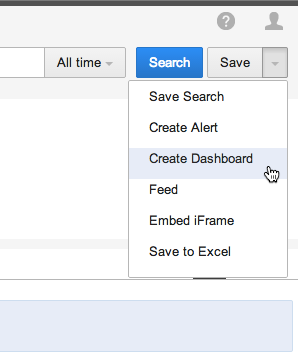
- Alternatively, you can use the save button's dropdown to create a dashboard from the current search query.
- Name your dashboard and provide an initial query (you can change both the name and the query later on). To include all documents, leave the query empty.
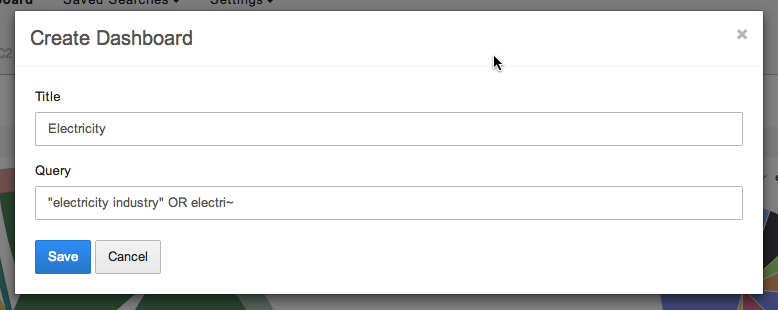
- Press SAVE.
Editing dashboards
To enter editing mode,
- Click the dashboard settings icon at the right upper corner of the dashboard,
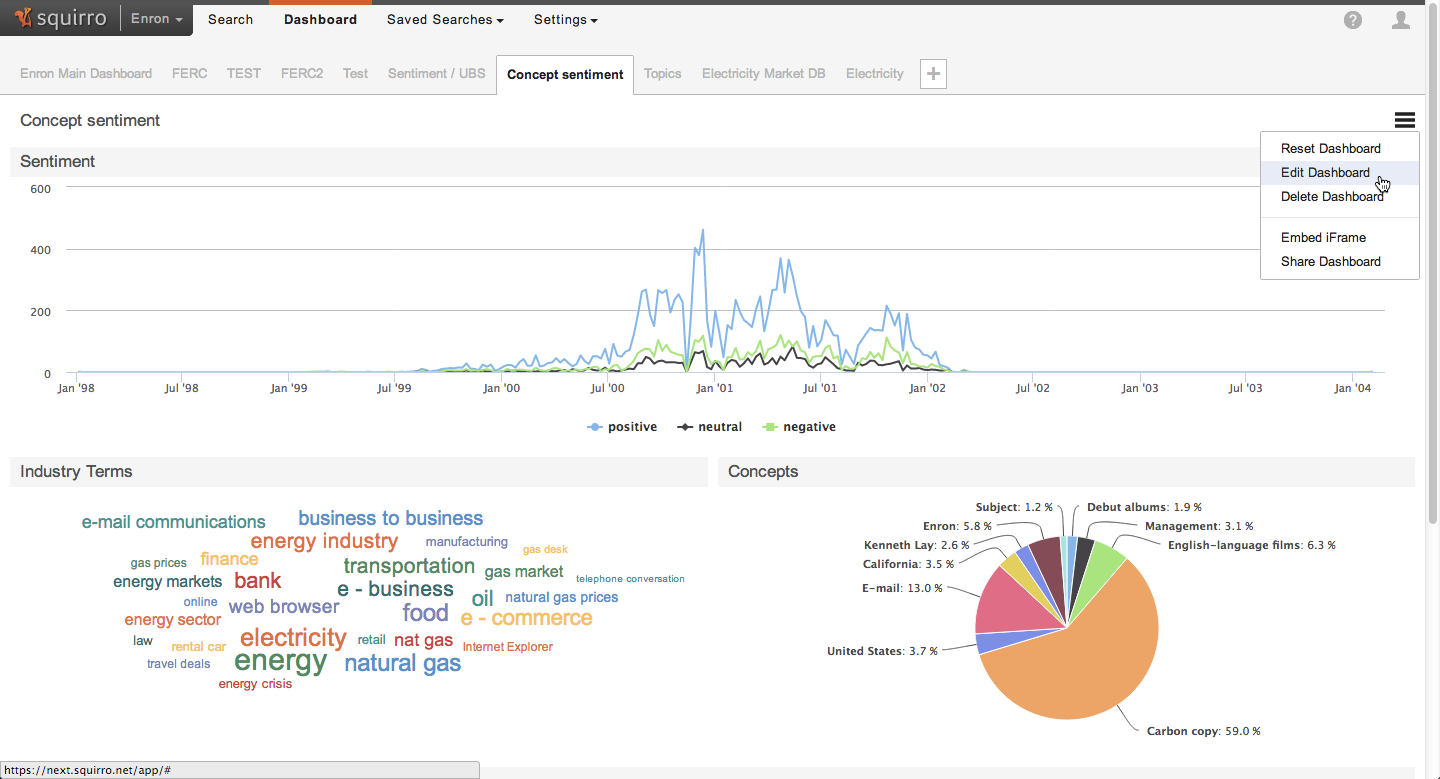
- Click on
Edit Dashboard. You are now in editing mode.
Change title and query of dashboard
To change your dashboard's main query or title,
- Enter editing mode using the steps described above,
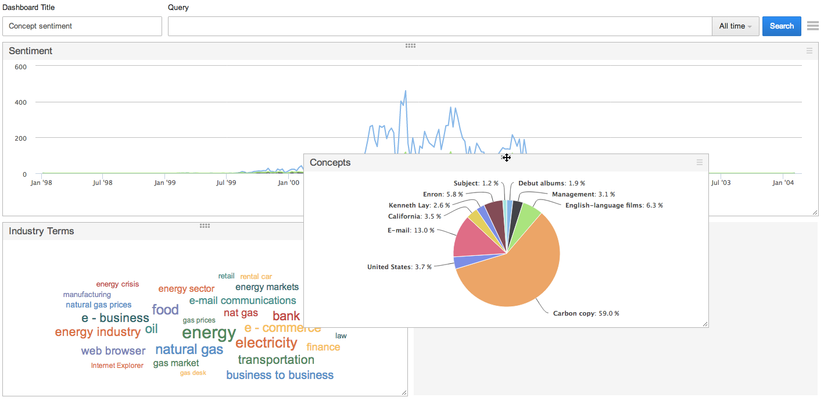
Enter the new title in the title field (1) and the new query in the search field (2).
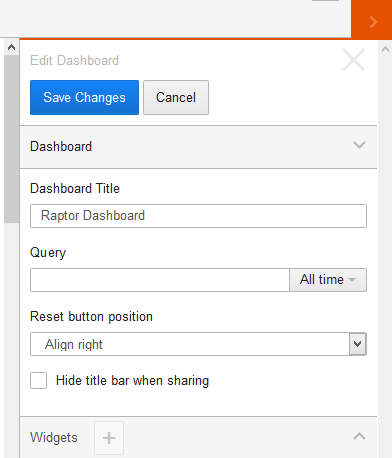
Once done, press
SAVEto save your changes or CANCEL to abandon them (3).
Widgets
Widgets are the building blocks of a dashboard. Each widget represents data in a particular form. Currently, Squirro offers a number of built-in widgets, such as pie charts, time frequency graphs (line charts) and word clouds.
Widget types
| Widget | Example | Requires | Best for |
|---|---|---|---|
| Cloud | 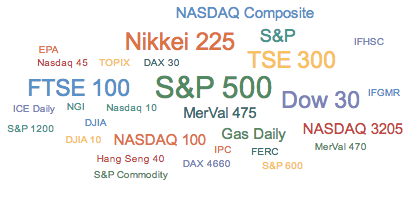 | Facet | Displaying the relative salience of terms, such as stock indices, where an accurate proportion is less important and a more intuitive, visual representation is desired. |
| Frequency graph | 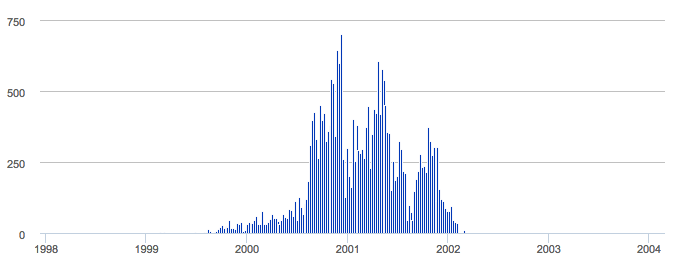 | Visualising frequency/volume of messages that meet the search criteria over time Facilitating time selection | |
| Keywords | 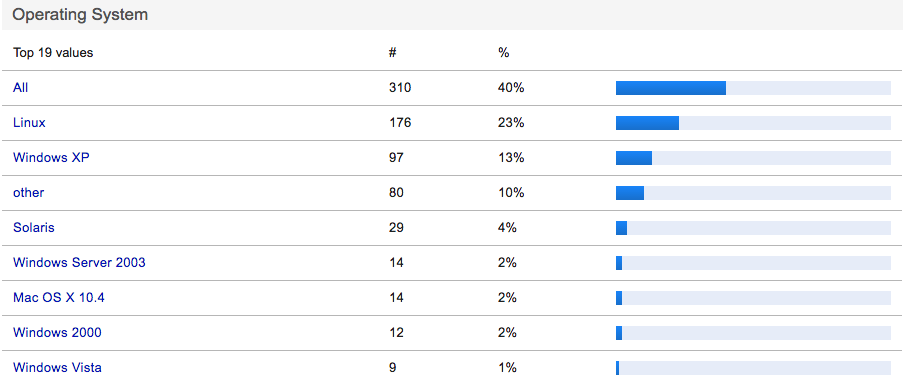 | Facet | Displaying the top keywords for any given facet. The Widget displays the name, count & percentage of the each values. The widgets reacts to the width of the widgets and well display the bar chart if not enough space is available. |
| Line chart | 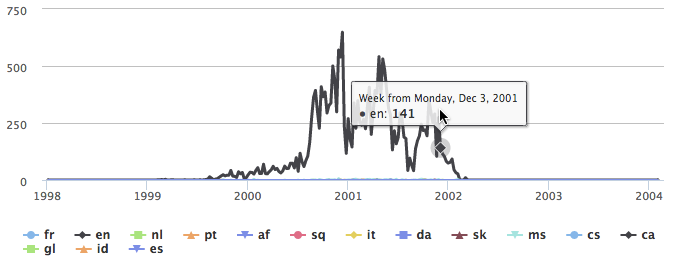 | Facet | Displaying time series values (frequency or volume versus time) of particular values for a facet. |
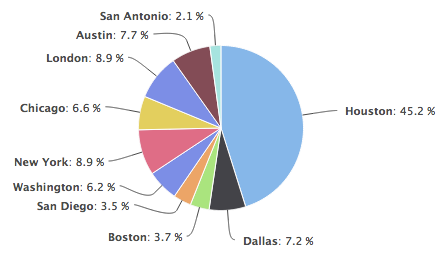
| Pie chart |
| Facet | Visualising relative proportions of values among facets (the percentages relate to all documents that have a value for the particular facet, i.e. 100% might be smaller than the size of all documents, since some might be untagged for that facet). |
| Result list | 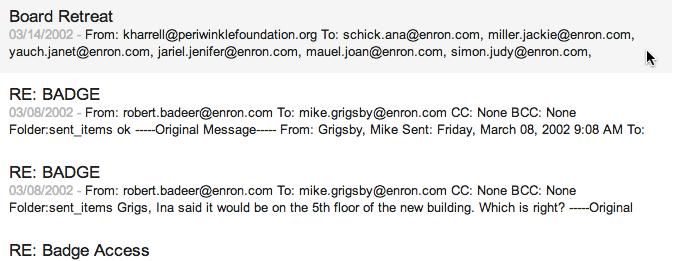 | Displaying results for individual examination. | |
| Search Query | 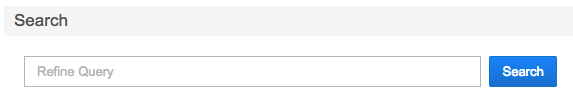 | Adds a search form to the dashboard, allowing the user to refine the results using full text search and the full Squirro Query language capabilities. Note: The search can only refine the existing query of the dashboard. | |
| Significant Terms | 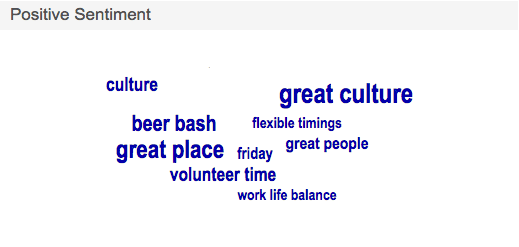 | Facet | Looks and behaves like the cloud widget, but applies the SignificantTerms analyser to display the uncommonly common values. Read more on Significant Terms Aggregation in this blog post by Elasticsearch. For this to work the data behind the dashboard must be segmented into a background and a foreground set. The widget will show significant values of the foreground set. The background set is defined by the Squirro query stored in the dashboard or via the &query url parameter. The foreground set is defined by another Squirro query using the &selection url parameter. |
Add widget
To add a widget,
- Enter edit mode on the dashboard,
- Click the dashboard settings button in the right upper corner of the dashboard,
- Select
Add widgetfrom the dropdown.
Moving widgets
To move a widget,
- Enter editing mode as described above,
- Click on the handle in the middle of the top frame of the widget,
- Drag widget using the handle.
Editing widgets
To edit a widget,
- Enter editing mode as described above,
- Click on the widget settings icon in the right upper corner of the widget's frame,
- Select
Editfrom the dropdown menu.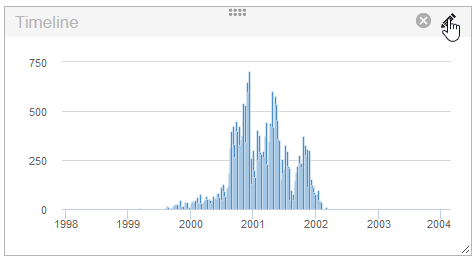
- Once you have made your changes, click
Saveto retain them orCancelto revert to the widget's original settings.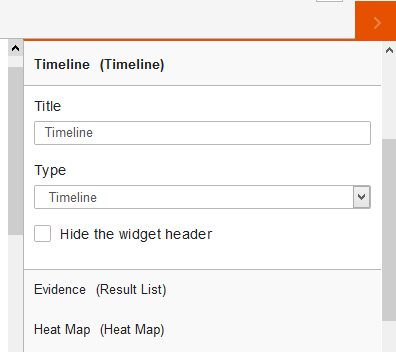
Deleting widgets
To delete a widget,
- Enter editing mode as described above,
- Click on the widget settings icon in the right upper corner of the widget's frame,
- Select
Removefrom the dropdown menu.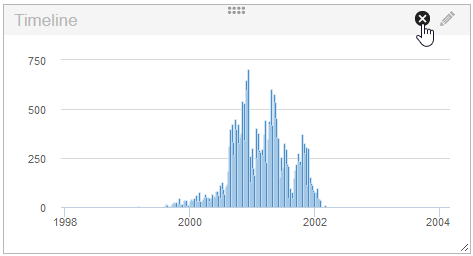
Embedding and Sharing Dashboards
To share or embed the current dashboard,
- Click the Dashboard Setting Button and select "Share Dashboard" or "Embed iFrame"
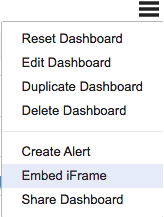
Both are technically the same, but the Embed iFrame offers an iframe HTML tag, instead of just a URL.
Dashboard URL API Reference
This API allows for easy integration into any web enabled 3rd party application.
Once you've collected the URL for your dashboard, the following URL parameters can be used to change the behavior of the dashboard.
| Parameter | Description | Example Value |
|---|---|---|
| query | Override the Dashboards search query | &query=(blue OR green OR red) |
| selection | Set the Foreground query for all Significant Terms widgets | &selection=blue |
| created_before | Only display results with a created_at value lower than this | &created_after=2012-12-31 |
| created_after | Only display results wit ha created_at value higher than this | &created_before=2014-12-31 &created_before=2014-12-31T18:30:00 |
| relative_start | Only display results with a created_at value higher than this, in relative terms to today | &relative_start=2y |
| relative_end | Only display results with a created_at value lower than this, in relative terms to today | &relative_end=1y &relative_end=4w |