Frontend performance tracing
There are two possible ways to record performance logging for the frontend:
- Offline: where the values are stored in a .csv file.
- Online: using New Relic.
This frontend performance logging can be enabled by setting frontend.performance option to true, in the configuration service.
To enable online performance logging (using New Relic), please set the frontend.new_relic option to true.
In case the frontend.performance option is set to true and frontend.new_relic is set to false, then offline logging will take place.
You can read more how to update configuration options here.
Backend performance tracing
Install jaeger
| Code Block |
|---|
$ sudo yum install squirro-jaeger |
Configure the firewall
| Code Block |
|---|
$ iptables -I INPUT -p tcp -m tcp --dport 14267 -j ACCEPT -s localhost -d localhost
$ iptables -I INPUT -p tcp -m tcp --dport 14268 -j ACCEPT -s localhost -d localhost
$ iptables -I INPUT -p tcp -m tcp --dport 16686 -j ACCEPT -s localhost -d localhost |
Enable tracing, ensure the following section is in /etc/squirro/common.ini
| Code Block |
|---|
[jaeger]
tracing = true
reporting_host = (localhost or ip of clusternode)
reporting_port = 5775 |
Restart the the services you want to trace, e.g.:
| Code Block |
|---|
$ service sqtopicd restart
$ service sqfrontendd restart |
Start the collector, agent and query sevices using the start_jaeger.sh script. Also, make sure to specify the Elasticsearch endpoint for storing the timing metrics:
| Code Block |
|---|
$ /opt/squirro/jaeger/start_jaeger.sh http://(localhost or ip of your storagenode):9200
|
The jaeger GUI now is available at http://127.0.0.1:16686
NOTE: When done performance testing, set the tracing flag back to false, restart services, stop the jaeger processes, and drop jaeger indices:
| Code Block |
|---|
$ curl -s -H "Content-Type: application/x-ndjson" -XGET http://localhost:81/ext/elastic/_cat/indices | grep jaeger | awk '{print $3}' | xargs -I % curl -s -H "Content-Type: application/x-ndjson" -X DELETE http://localhost:81/ext/elastic/%
|
Find most time consuming component in a request
...
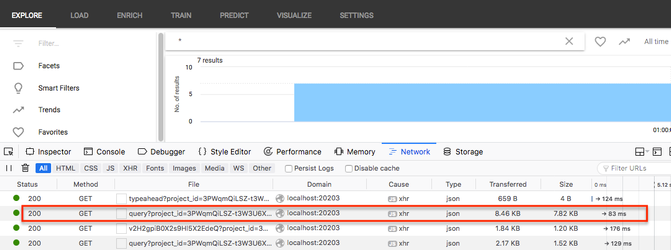
copy this request, add &timing=true&token={your_squirro_token}, and put it on address bar of browser to get the response.
The timing report should be look like below, time_took_ms is execution of each component and time_ms is total execution time. If you suspect Elasticsearch request is slow, look at the node Elasticsearch\/squirro... in the response to see how long it took.
...
This page can now be found at Investigating Performance Issues on the Squirro Docs site.
