...
| Table of Contents | ||
|---|---|---|
|
Chart Types
Pie Chart

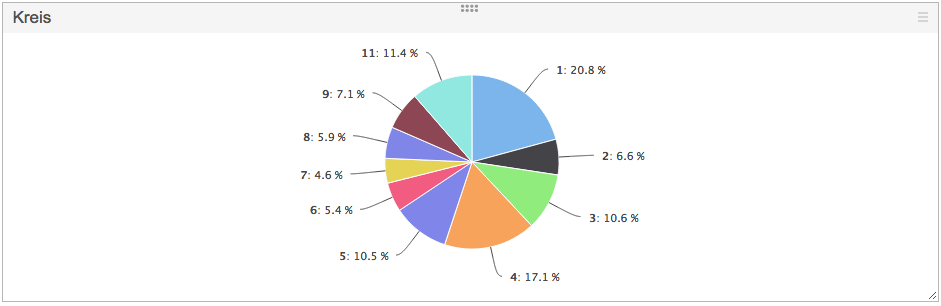
The Pie Chart is used to display values of a specific facet in a pie format, with legend.
The only configuration required is the facet, which values are populated on the chart.
Cloud Chart

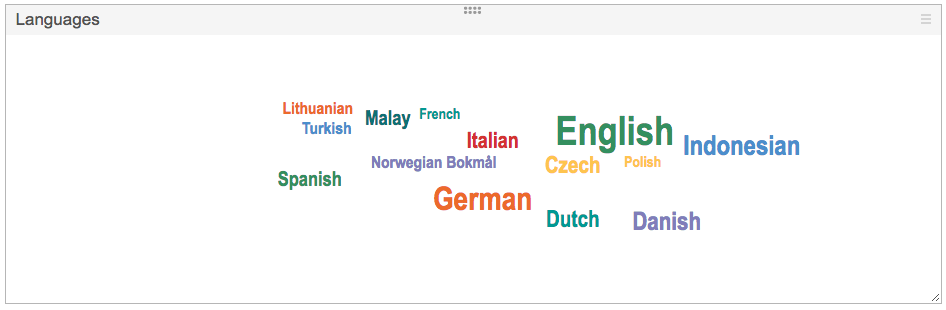
The Cloud chart displays values of several (between 1 and 6) different facets at once.
Each facet is assigned a color in which it is displayed on the chart.
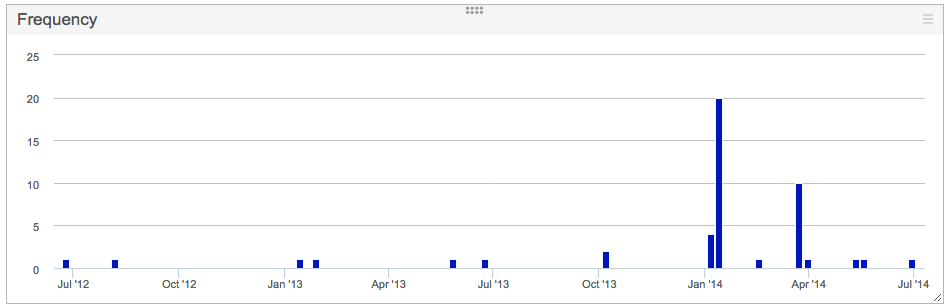
Line Chart

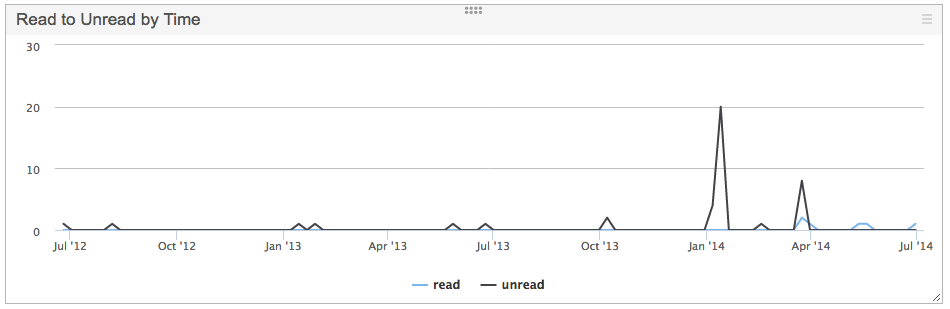
The Line chart displays facet values of one facet in the form of a time based line chart.
...
The only configuration required is to provide a facet to display on the chart.
Keywords
.png?version=1&modificationDate=1418903584252&cacheVersion=1&api=v2&height=250)
.png?version=1&modificationDate=1418903584252&cacheVersion=1&api=v2&width=800)
The Keywords list displays the top keywords for a facet, in a list format, with the number of matches in analysed documents, aswell as percentage based part of the set they represent.
To configure, provide a facet which values to display on the chart.
Significant Terms

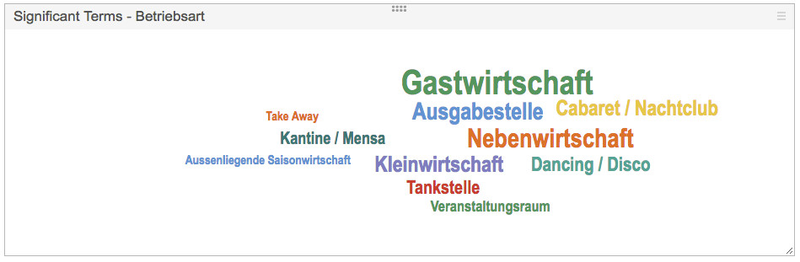
The Significant Terms provides visual information about terms which are especially significant in a dataset, comparing to another dataset.
More in-depth explanation and usage examples follows up later on this page, in the Configuration section.
Frequency

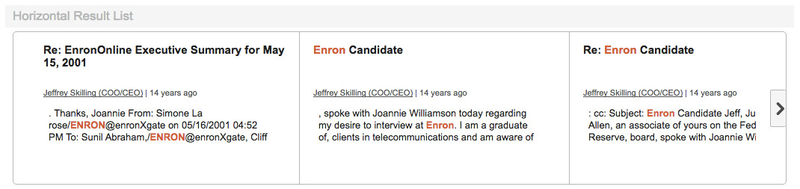
Result List

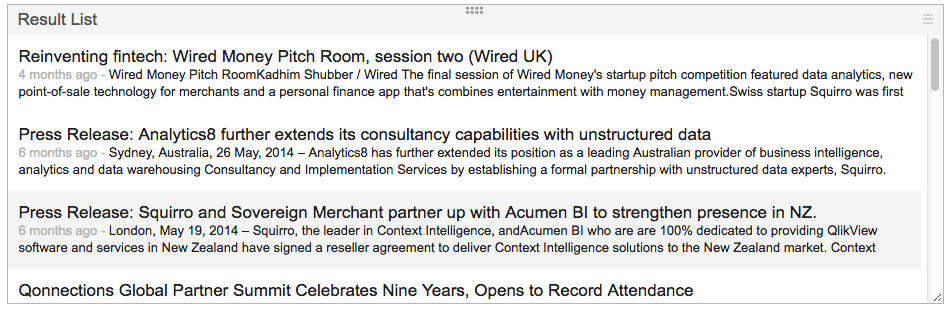
The Result List widget simply displays a list of results, as seen on the Search page. Clicking on a result will show its content in a pop-up window.
...
- %s - will be replaced by the current Dashboard query when resolving the URL.
- %tb - will be replaced by the beginning of the current Dashboard time range (if one is defined).
- %ta - will be replaced by the end of the current Dashboard time range (if one is defined).
- %u - will be replaced by the currently logged in user's name.
- %p - will be replaced by the current project's title.
- %d - will be replaced by the current (containing the IFrame widget) dashboard's title.
- %q[query_param] - will be replaced by the embedded dashboard's URL query param of the name query_param.
This is particularly useful in scenarios where the embedded dashboard gets injected some parameters from the outside environment.
By referencing them in the iFrame widget, it is possible to trickle them down to the referenced web endpoint.
Search Query

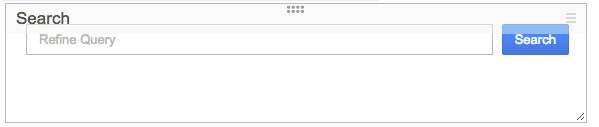
The Search Query widget is essentially a Squirro Search box, with the exception that it's aimed at refining the current dashboard query, rather than fully controlling it.
Any query put into the widget will be combined with the current dashboard selection using an AND operator.
Heat Map
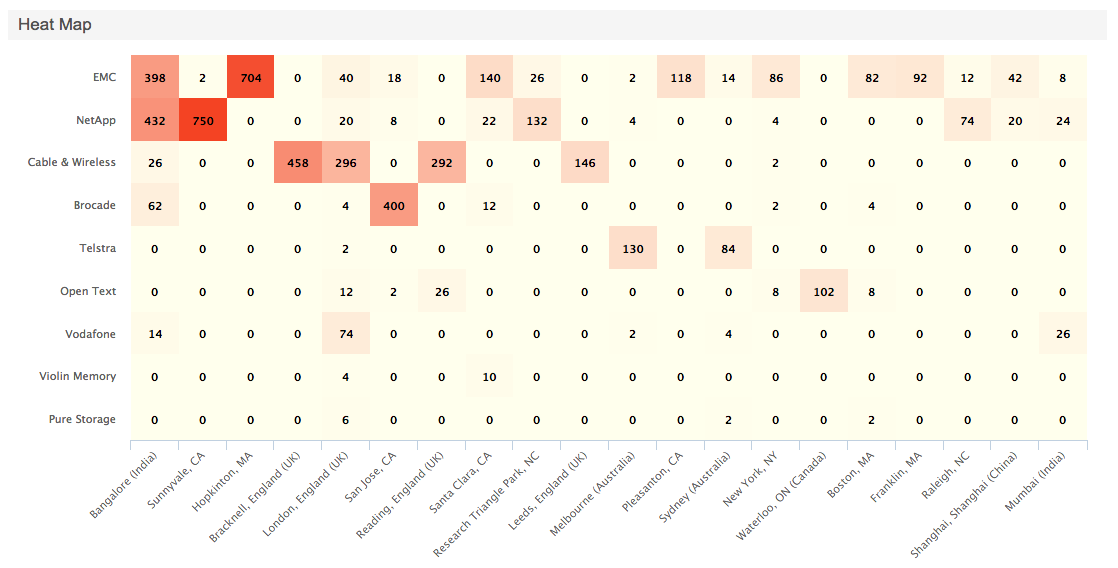
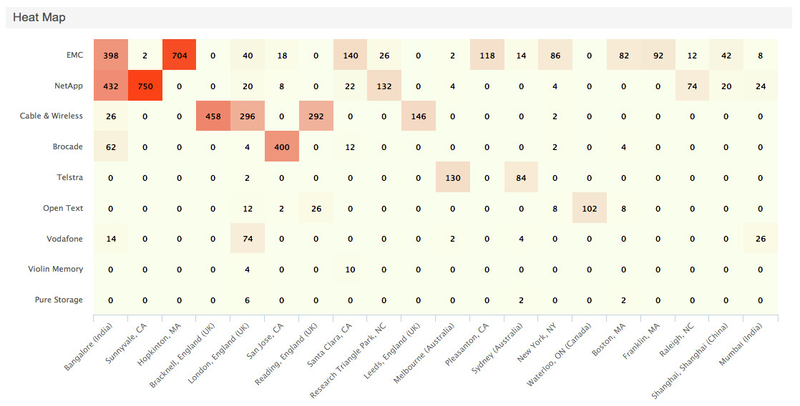
The Heat Map is a convenient way to represent the aggregations between two facets present in the project. During the configuration, facets for both of the axis are chosen, as well as the maximum size of the resulting matrix (the actual heat map). The data generation first resolves top values for the first facet, then for each of the top values aggregates over the second chosen facet, determining the weight of the connection between both facets. The weight determined is then used to present the number of mentions of both facets in items, present at the same time.
...
Additionally, it is possible to specify both the starting and ending color point for the Heat Map gradient, the starting point being the color applied to lowest values (mention counts), the ending point being the color applied to highest values. Color for all intermediate values is determined automatically via interpolation.
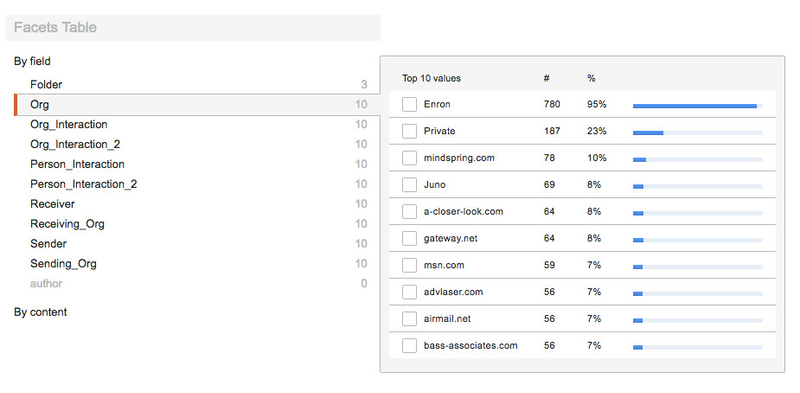
Facets Table

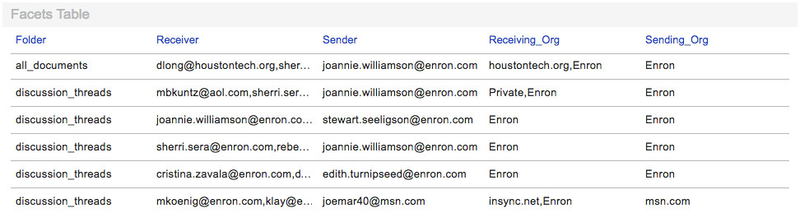
The Facet Table widget is used to display values of specific facets for every document in the result list.
It allows any combination of facets to be configured, resizing the columns with facet values, as well as sorting the entire dashboard (and subsequently, the widget itself) by any facet.
Facets List

The Facet List widget allows to display any combination of facets, and select specific facet values.
...
The widget also shows the number of duplicated items for each item in the top-right corner, should such items exist and duplicates have not been disabled in the widget's configuration.

Dashboard configuration
To configure a dashboard, it has to be created first.

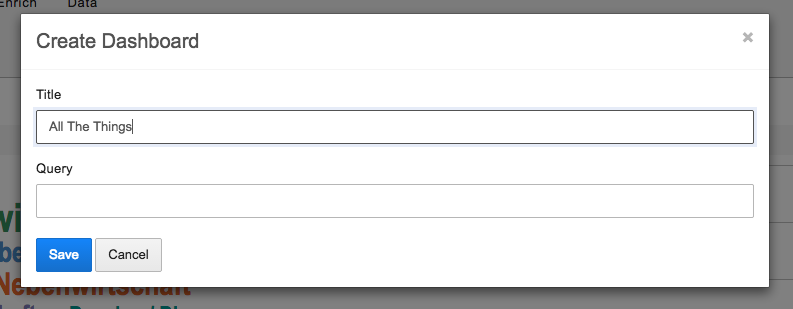
Directly after creation, the user is presented with a fresh dashboard, an empty widget and a configuration panel for it.

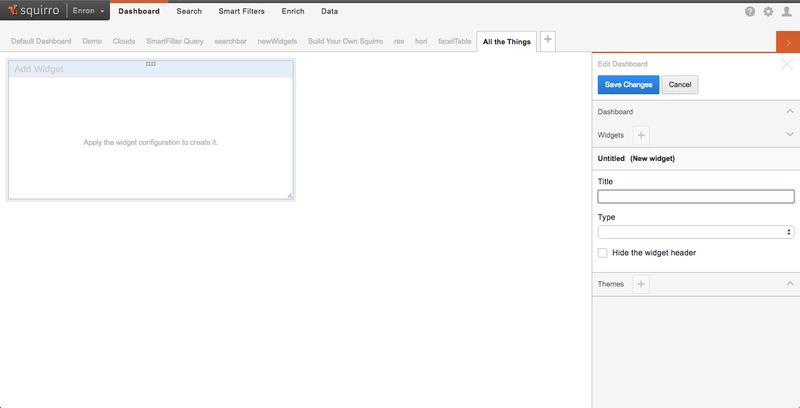
The editor panel displays on the right, which combines all the properties of the dashboard itself, as well as those of all the widgets, and visual themes.
...