...
Any query put into the widget will be combined with the current dashboard selection using an AND operator.
Heat Map
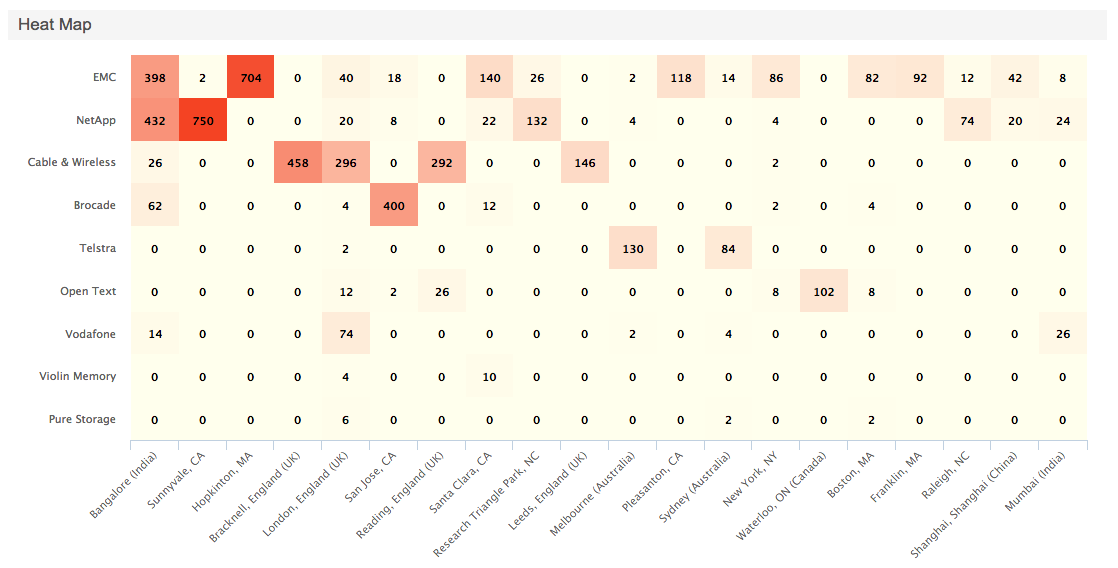
The Heat Map is a convenient way to represent the aggregations between two facets present in the project. During the configuration, facets for both of the axis are chosen, as well
as the maximum size of the resulting matrix (the actual heatmap). The data generation first resolves top values for first facet, then for each of the top values aggregates over the
second chosen facet, determining the weight of the connection between both facets. The weight determined is then used to present the number of mentions of both facets in items,
present at the same time.
Clicking on a box in the heatmap will drill down the current query to items which satisfy both facet:value conditions as per the clicked box.
Additionally, it is possible to specify both the starting and ending color point for the Heat Map gradient, the starting point being the color applied to lowest values (mention counts),
the ending point being the color applied to highest values. Color for all intermediate values is determined automatically via interpolation.
Dashboard configuration
To configure a dashboard, it has to be created first.
...