...
- The IFrame widget allows embedding websites into the Squirro Dashboard. The configuration has one parameter only, the URL.
- In order to embed a website as an iFrame, it must itself support that via X-Frame-Options, aswell as being served via the same protocol as Squirro itself (http / https).
- The URL must be well formatted, including the protocol (eg. http://www.squirro.com).
- There are several parameters in the URL that one can use to extend the functionality. Using those optional parameters allows a limited channel of communication to be created between Squirro and the embedded webpage.
- %s - will be replaced by the current Dashboard query when resolving the URL.
- %ta - will be replaced by the beginning of the current Dashboard time range (time-after) (if one is defined).
- %tb - will be replaced by the end of the current Dashboard time range (time-before) (if one is defined).
- %u - will be replaced by the currently logged in user's name.
- %p - will be replaced by the current project's title.
- %d - will be replaced by the current (containing the IFrame widget) dashboard's title.
- %q[query_param] - will be replaced by the embedded dashboard's URL query param of the name query_param.
This is particularly useful in scenarios where the embedded dashboard gets injected some parameters from the outside environment.
By referencing them in the iFrame widget, it is possible to trickle them down to the referenced web endpoint.

Line Chart
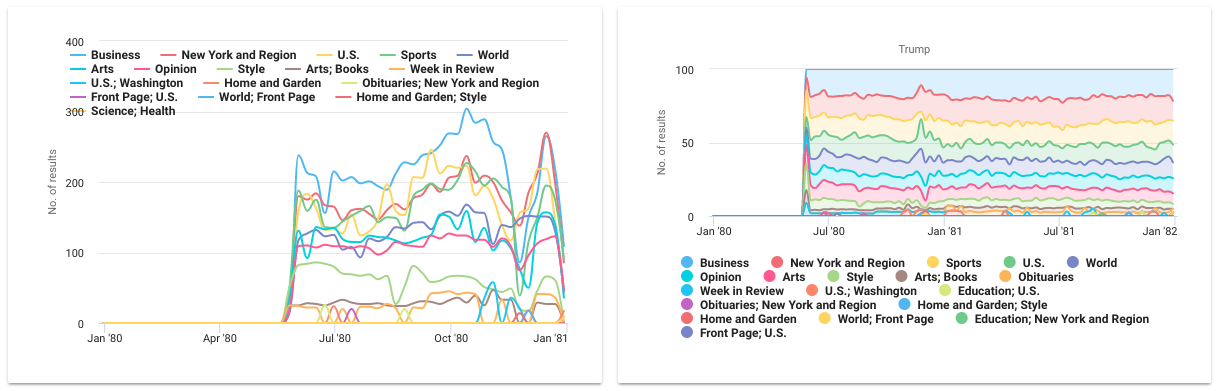
- The Line chart displays facet values of one facet in the form of a time based line chart.
- This is be particularly useful if the dataset contains dates in one of the facets.
- The only configuration required is to provide a facet to display on the chart.
Link
The Link widget can be used to display a link to a url.
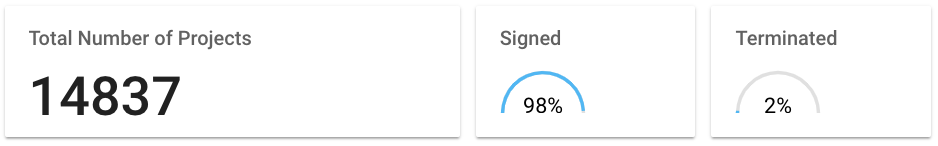
Metric
...
- Metrics widget can be used to display
...
- the count of a single metric to create high level summary of the dashboard. Example: No. of incidents reported.
- The widget needs to be configured by a 'Base Query', which is the query behind a particular metric.
- To see the percentage contribution of one metric over the other, both the 'Base Query' and the 'Sub Query' need to be defined. Example: Percentage of tickets closed out of total tickets.
- The percentage contribution is displayed using the percentage gauge variation of the widget.
Pie Chart
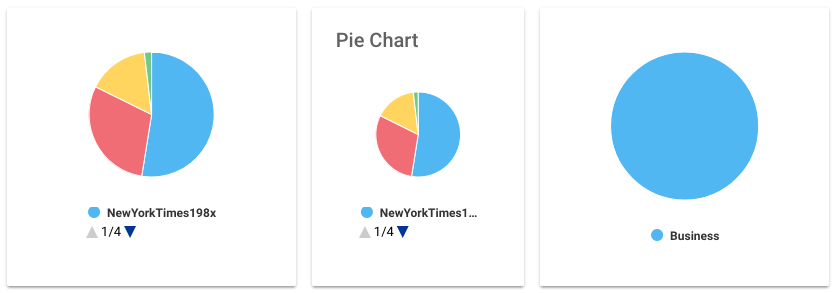
The Pie Chart is used to display values of a specific facet in a pie format, a pie chart legend can be enabled if required through the settings.
...