...
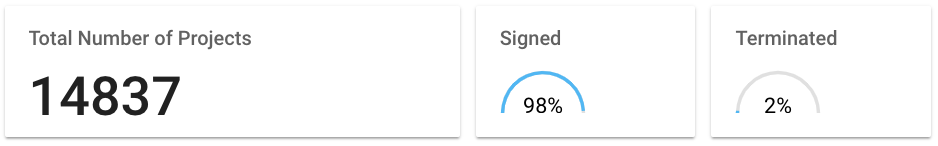
The metric widget can be used to display a total count of records or a percetnage guage using two queries.
Pie Chart

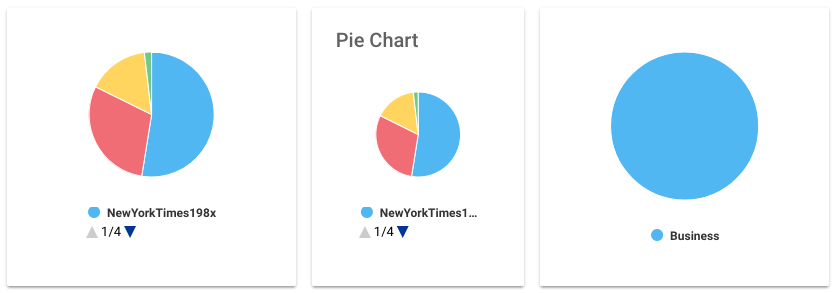
The Pie Chart is used to display values of a specific facet in a pie format, a pie chart legend can be enabled if required through the settings.
...
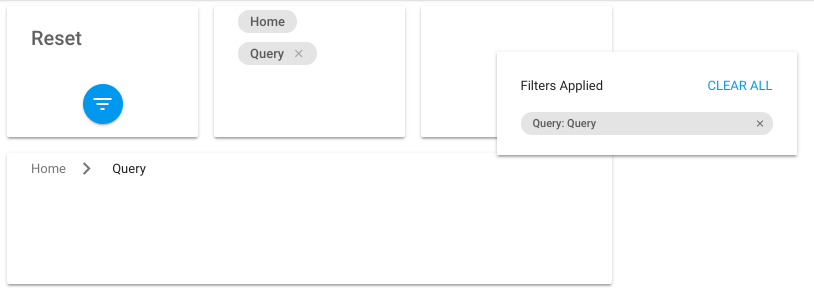
The Reset widget shows the list of filters currently applied to the dashboard and allows the user to clear them.

Result List
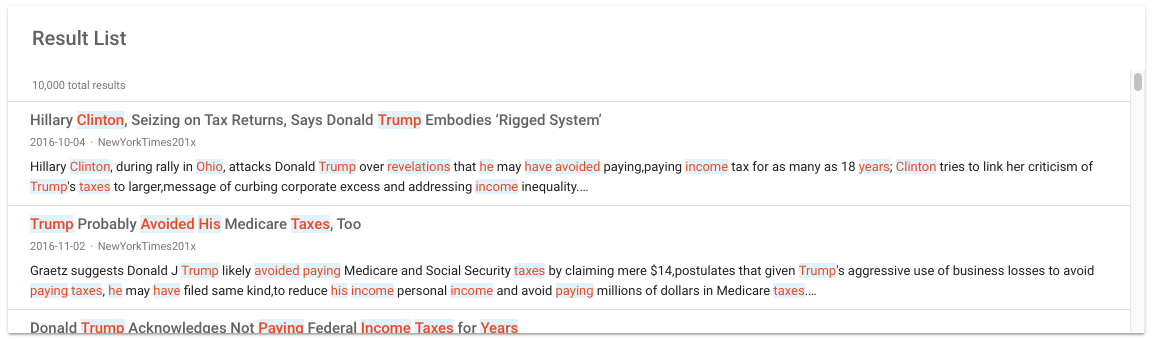
The Result List widget simply displays a list of results, as seen on the Search page. Clicking on a result will show its content in a pop-up window.
...
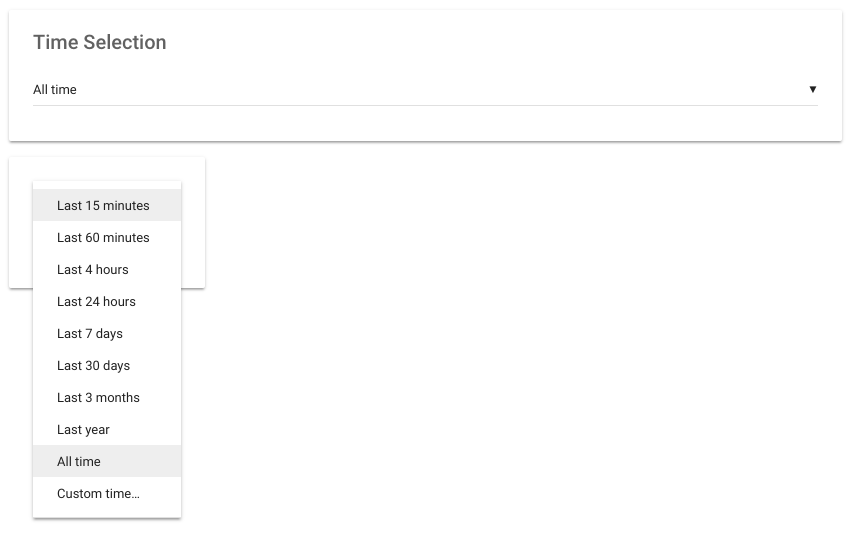
The Time Selection widget can be used to display a predefined set of time based queries. This can also be configured to be shown as a dropdown.


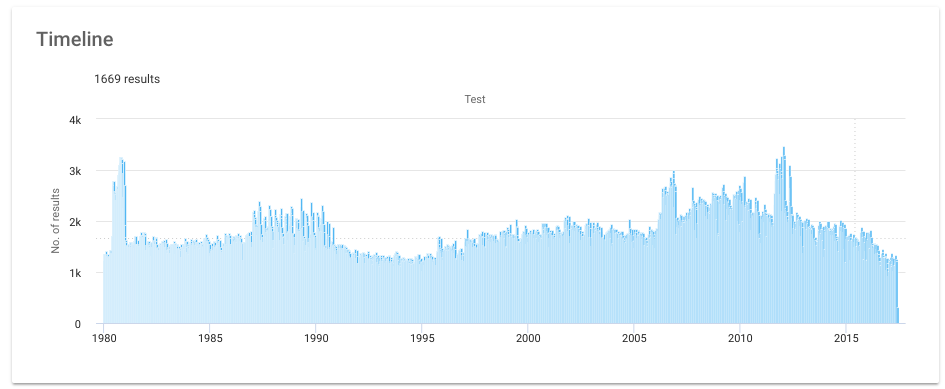
Timeline

Trend
The Trend widget is used as part of the Trend Detection to visualize the trend, anomalies and predictions for data in a project.
...