...
- The Facet List widget can be configured to display all contributing facets in the project or combination of desired facets.
- Hovering over the facet field displays the distribution of actual facet values, sorted by top 10 values.
- Clicking on an individual value filters the result list. Multi-selection of values is supported as well by pressing the modifier key, Cmd for Apple Macs, Ctrl for Microsoft Windows systems.
- The widget can be displayed as a list and as dropdown buttons.

Facets Table
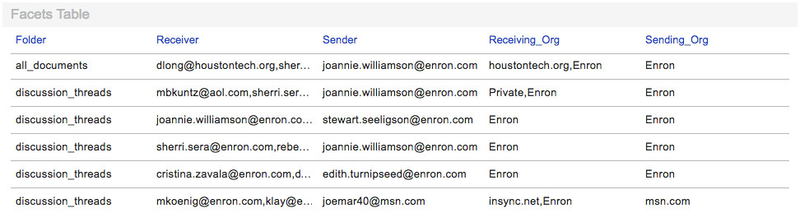
The Facet Table widget is used to display values of specific facets for every document in the result list.
It allows any combination of facets to be configured, resizing the columns with facet values, as well as sorting the entire dashboard (and subsequently, the widget itself) by any facet.

Favorites
The Favorites widget can be used to display queries that have been set as Favorites or for which an Alert has been defined.
...
The only configuration required is the facet, which values are populated on the chart.
Recommendations

Use entities to create Recommendations.
Region Map
The region map can be used for maop based data visulizations.
...