...
- The Facet Table widget is used to display values of specific facets for every document in the result list.
- It allows displaying additional fields like title, body and creation date in the columns.
- Column width can be re-sized. The entire dashboard (and subsequently, the widget itself) can be sorted by any facet or multi-sorted by combination of facets.
- Clicking on a row display the item either in the side panel or in a modal window.

Favorites
- The Favorites widget can be used to display queries that have been
...
- marked as Favorites or for which an Alert has been defined.
- Clicking on the Favorite (heart) icon, marks the current query as Favorite. The heart icon can be displayed by enabling the searchbar widget to 'Show Favorite button'.
- The widget can be displayed as a list and as dropdown buttons.

Heat Map
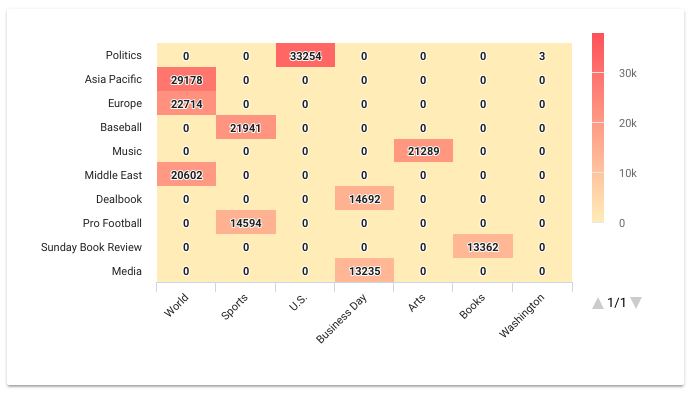
The Heat Map is a convenient way to represent the aggregations between two facets present in the project. During the configuration, facets for both of the axis are chosen, as well as the maximum size of the resulting matrix (the actual heat map). The data generation first resolves top values for the first facet, then for each of the top values aggregates over the second chosen facet, determining the weight of the connection between both facets. The weight determined is then used to present the number of mentions of both facets in items, present at the same time.
...