...
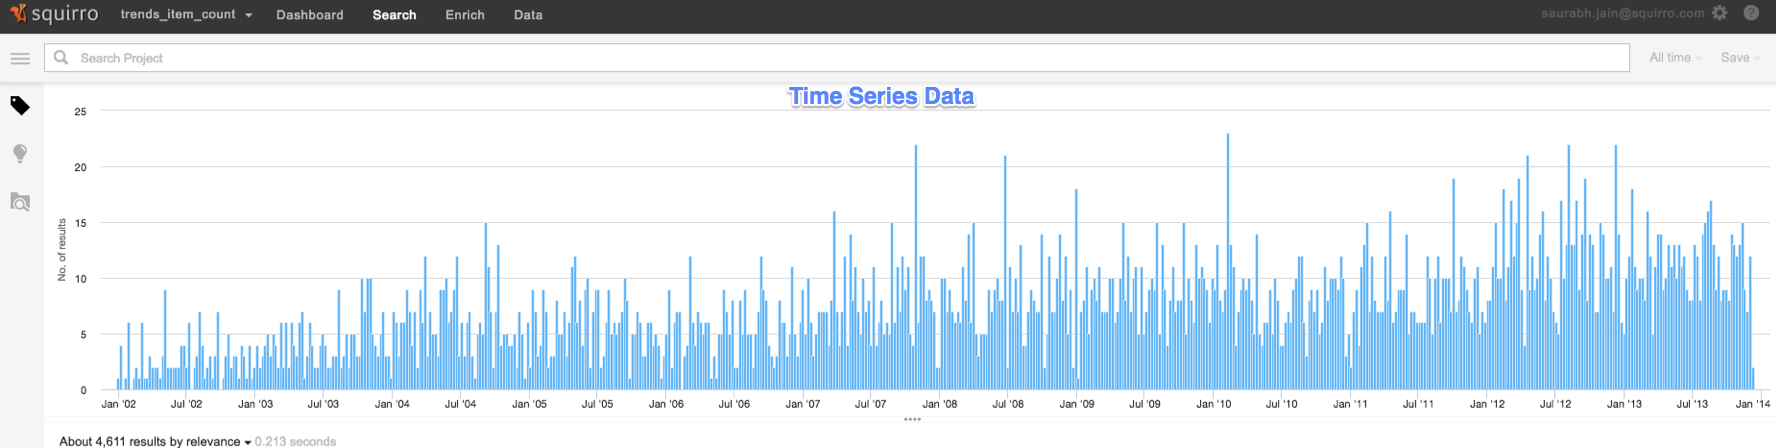
The Trend Detection analysis can be used to detect unusual trends in the time series data. In the Squirro context, time series data is generated in the form of the number-of-items per time-unit in a particular project for a particular query. This time series data can be easily observed today with the histogram bins on the search page (see image below). Moreover, the numerical facets in Squirro can also be visualized on the dashboard as a time series using the "Line chart" widget. First example of time series data in Squirro context i.e. the item-counts is shown in the screenshot below. Trend detection analysis aims to find unusually high peaks in this histogram/time-series automatically.

As an example scenario, consider a project `News` with a feed of all the news-items from a few of the major news publications. Now, a query like `Facebook AND Whatsapp` will filter the list of all the documents to a sub-list of documents/news-items containing both the words Facebook and Whatsapp. For the project `News` with query `Facebook AND Whatsapp`, we define a time-series as the number of items matching `Facebook AND Whatsapp` per time-unit, where time-unit can be hourly, weekly, daily, monthly or yearly.
...