...
- One can also use the "Create Trend" modal to create a new trend detection on a numerical facet.
- In the presence of a numerical facet, the "Create Trend" dialog will have an extra checkbox to set up the trend detection on a numerical facet rather than the item counts
 .
. - In the current example, we set up the Trend Detection on a numerical facet named "service_tickets" which we have created while importing the data
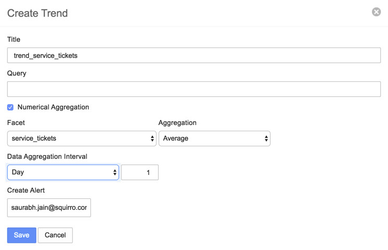
- Using this "Numerical Aggregation" checkbox, one can select a particular numerical facet of interest. In this example, we select the facet "service_tickets"
- Once a numerical facet has been selected, one can choose the aggregation method to be used on the numerical facet before setting up the trend detection. Possible options for aggregation are: Sum, Average, and Minimum. We choose "Average" for this particular example.
- Moreover, in this example, we want to analyze data in a daily bucket rather than the default weekly bucket. So, we set up the "Data Aggregation Interval" to 1 day.
- The rest of the workflow for setting up the Trend Detection is similar to the workflow for setting up the Trend Detection on the item-counts.
...
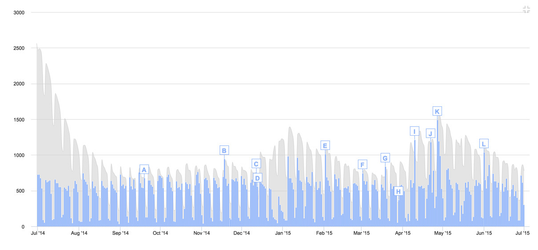
- Once set up, the detected anomalies can be visualized on the dashboard using a new "Trends widget" on the dashboard.
- One can select the "Trends" widget under the dashboard edit mode by adding a new widget of type "Trend" as show in the screenshot below.

- Once selectedAfter selecting the Trend widget, one can choose between all the trend detections set up on the project as shown in the screenshot below, where one can select between two different trend-detections.

- Once selected, one can should see the visualizations on the Trend widget as shown in the screenshot below

...
- .
Visualizations of future predictions using Trend Widget
For time series with recognizable repeating patterns, the future values of the time series can also be predicted and visualized. In order to turn on the predictions visualization, go to the edit mode of the "Trends" widget and check the "Enable Predictions" checkbox.
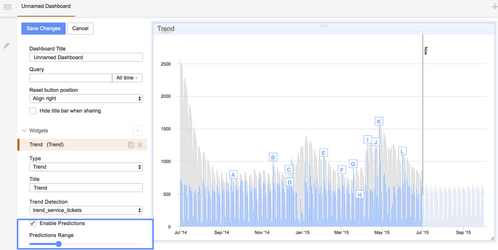
After checking the "Enable Predictions" check-box, the Trends widget will be updated with the future predictions of the time series data based on the repeating patterns recognized by Squirro in the historical data. Moreover, the number of future predictions being displayed can be adjusted using the "Predictions Range" slider.
Conclusion
The two examples in this tutorial led you through two main scenarios for using Trend-Detection
...