...
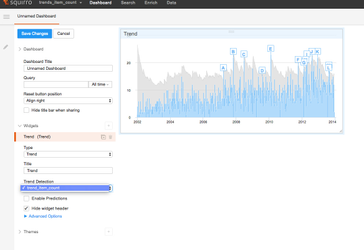
- Once you select the "Trend" type of widget, one can see all the Trend Detections which have been set up on this particular project under the "Trend Detections" heading. On selecting a particular Trend Detection, the widget shows the result of trend detection analysis i.e. the time series data (in blue), the automatically computed thresholds (in grey) and finally the detected anomalies (in lettered label flags).
Trend
...
Detection with query
pass
Visualization using Trend widget
...
- Download the csv data for this section of the tutorial from here.
Create a new Squirro project and add a new facet of type int with name "service_tickets" using the Squirro UI.
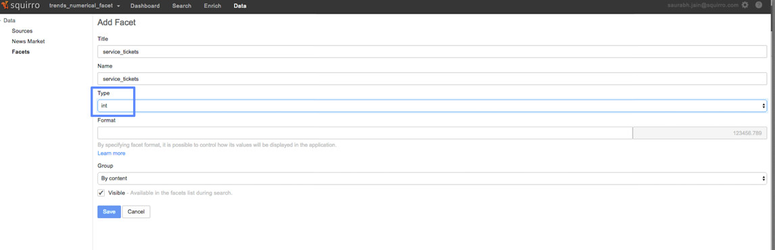
Info Please make sure that the new facet is of type "int". Without proper configuration of the facet-type, you will not be able to set up the Trend Detection on this facet.
Now import the CSV data into the Squirro project using the Squirro UI as described in the Scenario 1 set up. Make sure that the "datetime" field from the csv is mapped to "Creation Date" while leaving all the other mappings as default while using the CSV importer.
...
Trend Detection on numerical facet
- One can also use the "Create Trend" modal to create a new trend detection on a numerical facet.
- In the presence of a numerical facet, the "Create Trend" dialog will have an extra checkbox to set up the trend detection on a numerical facet rather than the item counts

- Using this "Numerical Aggregation" checkbox, one can select a particular numerical facet of interest.
- Once a numerical facet has been selected, one can choose the aggregation method to be used on the numerical facet before setting up the trend detection. Possible options for aggregation are: Sum, Average, and Minimum.
- The rest of the workflow for setting up the Trend Detection is similar to the workflow for setting up the Trend Detection on the item-counts.
...
Visualizations using Trend widget
| Info |
|---|
A Trends widget on the dashboard first requires a Trend-Detection to be set up first using the "Search" tab of Squirro. |
- Once set up, the detected anomalies can be visualized on the dashboard using a new "Trends widget" on the dashboard.
- One can select the "Trends" widget under the dashboard edit mode by adding a new widget of type "Trend" as show in the screenshot below.

- Once selected, one can choose between all the trend detections set up on the project as shown in the screenshot below, where one can select between two different trend-detections.

- Once selected, one can see the visualizations on the Trend widget as shown below


Conclusion
The two examples in this tutorial led you through two main scenarios for using Trend-Detection
...