...
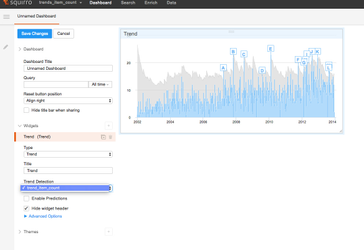
- Once you select the "Trend" type of widget, one can see all the Trend Detections which have been set up on this particular project under the "Trend Detections" heading. On selecting a particular Trend Detection, the widget shows the result of trend detection analysis i.e. the time series data (in blue), the automatically computed thresholds (in grey) and finally the detected anomalies (in lettered label flags).
Automated alerting on future anomalies
| Info |
|---|
This step of the tutorial can only be executed against the Squirro demo cluster. |
Once, we have set up a trend detection for a particular scenario, Squirro can also automatically alert us via email if it detects any anomalies in the future data. If one wish to simulate this behavior, we provide a python script with a configuration file. This python script will upload new "future" items into the Squirro project and once the number of items uploaded breaches the automatic threshold, you will see an alert email in your mail box.
- In order to replicate this behavior, please make sure that you have the latest version of SquirroClient installed on your local machine.
- Download this zip file containing a python script and a config file.
- Add the "project_id" and the User token in the config file as shown below.
- Execute the python script using "python upload_new_items.py" command.
- After the script has completed uploading the new items, you will see an alert email in your inbox.
Trend Detection with query
...