...
| Excerpt |
|---|
This section shows how the different data types of facets affect their usage in queries and dashboards. Facets are typically set up within a project using a facets.json file used by the data loader. |
...
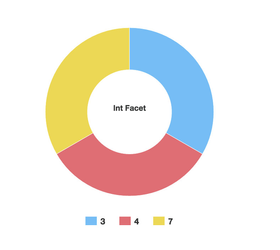
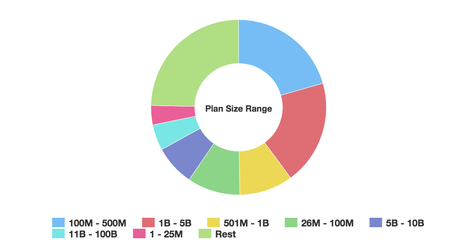
When numeric facet values are visualized directly, the visualization behaves similarly to a string facet, and the different values within the numeric facet are shown by the widget. In many cases, a better option is to use a pipelet which breaks the numeric facet data out into ranges (<1, 1-10, 10-50, 50+, etc.). These ranges can be stored in a separate string facet, then visualized more effectively.
|
|
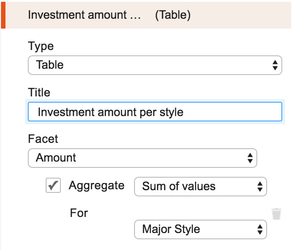
Aggregating Facet Values
When numeric facet values are aggregated, the widget shows an aggregation (sum, average, ...) of the values in the numeric facet, across all of the documents which have a common value in another facet.
...
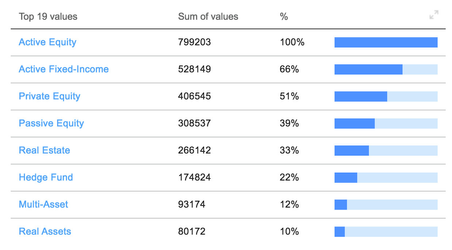
The example below is a table widget which shows an aggregation of a float facet (the $ amount of each investment), aggregated by a string facet (the investment type).
|
|
Sorting
Within a table widget in a dashboard, documents can be sorted based on the values that they contain in one or more facets.
...