This tutorial goes step by step through setting up a Trend Detection on a Squirro project and visualizing it on a Squirro dashboard.
Table of Contents
Introduction
The Trend Detection analysis can be used to detect unusual trends in time series data.
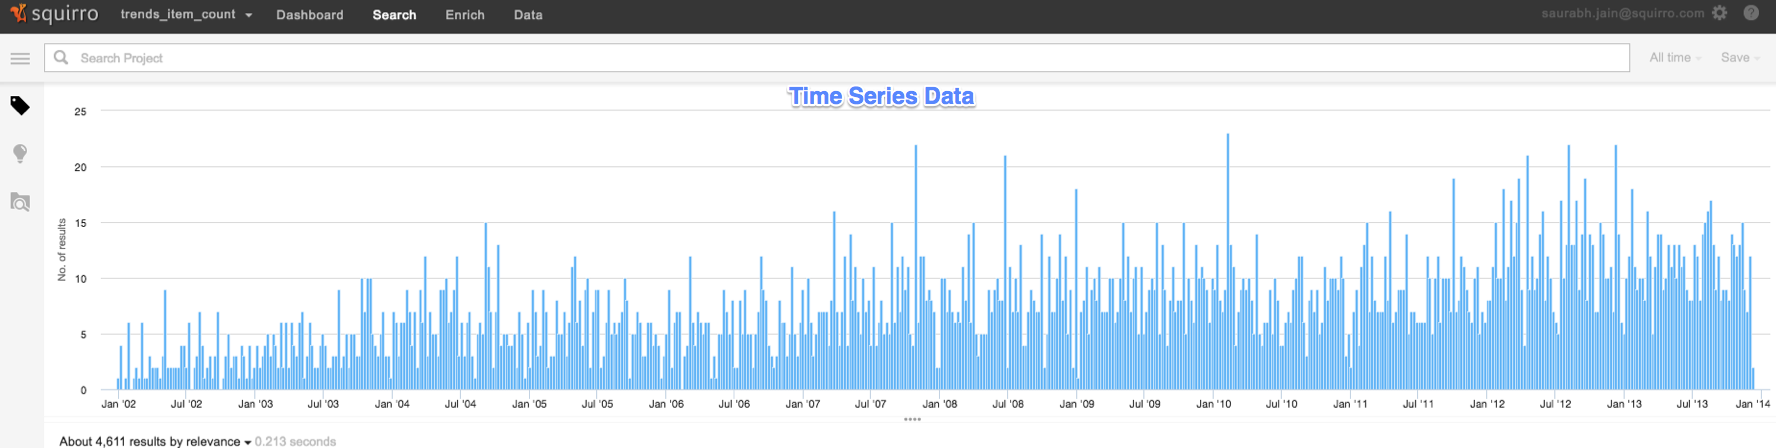
In the Squirro context, time series data is generated in the form of the number-of-items per time-unit in a particular project for a particular query. This time series data can be easily observed today with the histogram bins on the search page (see image below). Moreover, the numerical facets in Squirro can also be visualized on the dashboard as a time series using the "Line chart" widget. First example of time series data in Squirro context i.e. the item-counts is shown in the screenshot below. Trend detection can be used to automatically find anomalies - unusually high peaks in this histogram/time-series.
As an example scenario, consider a news project with a feed of all the news items from a few of the major news publications. A query like "Facebook AND Whatsapp" will filter the list of all the documents to a sub-list of documents/news-items containing both the words Facebook and Whatsapp. The time series for this particular query i Squirro is now the number of items matching "Facebook AND Whatsapp" for each time-unit, where time-unit can be hourly, weekly, daily, monthly or yearly.
The detection of unusual trends is done by learning from the historical data to auto-compute a reasonable threshold. So, in order for it to work properly it is important that Squirro has enough historical data to learn from.
As a rule of thumb, it is advisable to have at least two weeks worth of data.
Scenario 1 - Trend Detection on item counts
This first scenario guides you through the process of setting up Trend Detection on the number of items in a Squirro project over time. These item counts can also be filtered with a Squirro Query as filtering step before setting up the Trend Detection analysis. Both of these use cases are covered in the subsequent subsections below.
Importing data into Squirro Project
The data used in this example is an export from an open source bug tracker (Apache HTTP Server) with the summary removed. As a first step, import the data into Squirro.
- Download the CSV file: trends_tutorial_scenario1_dataset.csv.
- Create a new Squirro project.
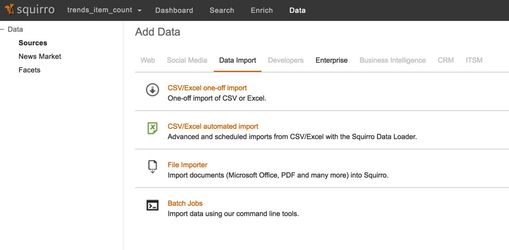
- In the Data tab choose the "CSV/Excel one-off import" option.
- Go through the process and import the data. In the mapping step you can use the auto-detected default mapping and simply continue.
Trend Detection without query
Set up Trend Detection
As a first step create a simple Trend Detection.
For this, switch over to the search screen. The data may not yet have been fully imported, but that's fine - it will arrive.
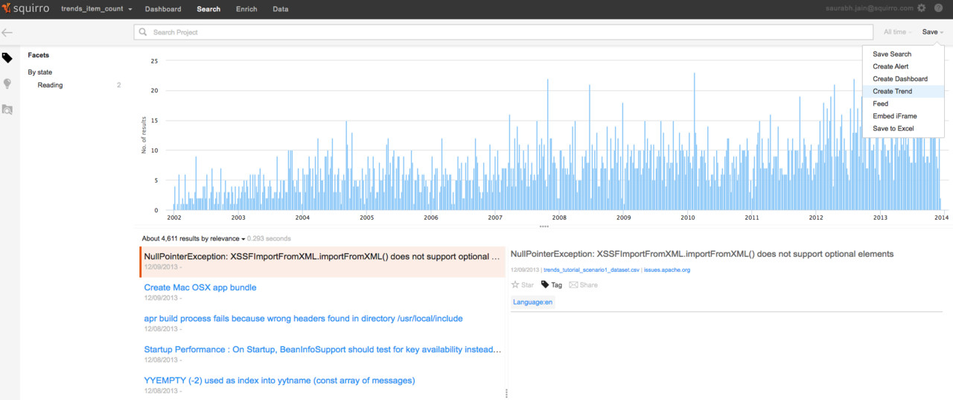
- Use the "Create Trend" option from the "Save" button drop down to start the process.
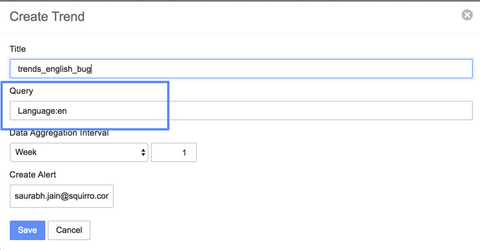
- In the "Create Trend" popup fill in the information described below:
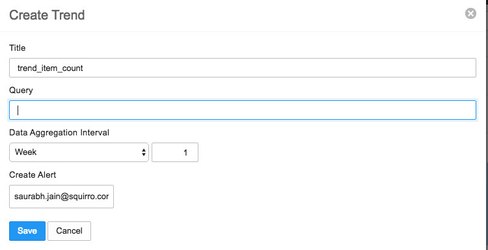
The following information has been filled here:- Title – the name of this Trend Detection. This is later used to find the right trend in the dashboard configuration.
- Query – the Squirro query used to filter down the item-counts. This defaults to the current query from the search screen.
- Data Aggregation Interval – the length of one time bucket. See the Aggregation Interval reference for full information on this.
- Create Alert – the email address which is notified when an anomaly is detected. This uses the current user's email address by default.
- Click the "Save" button to complete setting up the Trend Detection.
After this process, Squirro is now prepared to visualize and alert on the trend.
Performance Impact
Each created trend needs to be analyzed when processing data through the pipeline. So if you don't need a configured trend anymore, make sure you remove it.
Removing is not currently possible in the user interface but available through the API or the SDK.
Visualize in Dashboard
To visualize the created trend in the dashboard, there is a separate widget: Trends.
- Go to the dashboards and create a new dashboard.
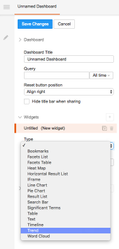
- Change the default widget's type to "Trend"
- For the "Trend Detection" option choose the trend that has been created in the previous section.
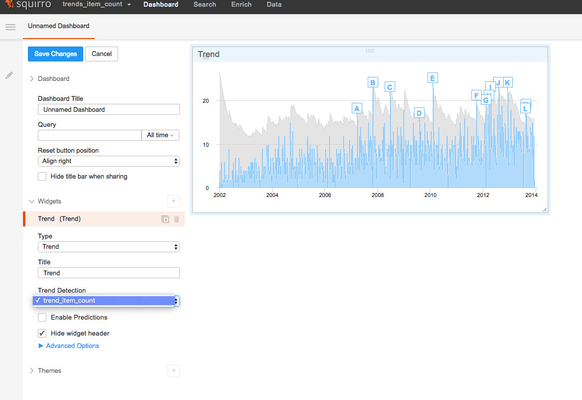
- Save the dashboard.
When selecting the configured trend in step 3, the widget updates and shows the result of the trend detection analysis. The chart shows three different sections out of the box:
- The time series data in blue
- The automatically computed thresholds in grey
- The detected anomalies as letters in boxes
Testing Alerts
To test alerting by email we need to add some data in real time. Because this requires the date and time to be current, this can not be done through the CSV import but instead requires a small script.
This step is optional. You can skip this, if you don't need to test the alerting.
- Install the Python SDK. See the Python SDK Installation section for documentation on this.
- Download the simulation script: trends_alert_simulation.zip.
- Extract the ZIP file on your local system.
- Edit the configuration file
config.iniand add your project_id and token. You can also change the cluster setting to connect to a different Squirro installation.
See Connecting to Squirro for information on how to find these values. - On the command line execute the python script:
python upload_new_items.py - Check your email inbox for the Squirro alert.
Trend Detection with query
Set up Trend Detection
To detect trends only on a subset of the data, you can specify a query.
- Go back to the Search screen.
- Use the query "Language:en" (without the quotes)
- Create a trend. The query is auto-filled in the popup dialog.
- Save the trend.
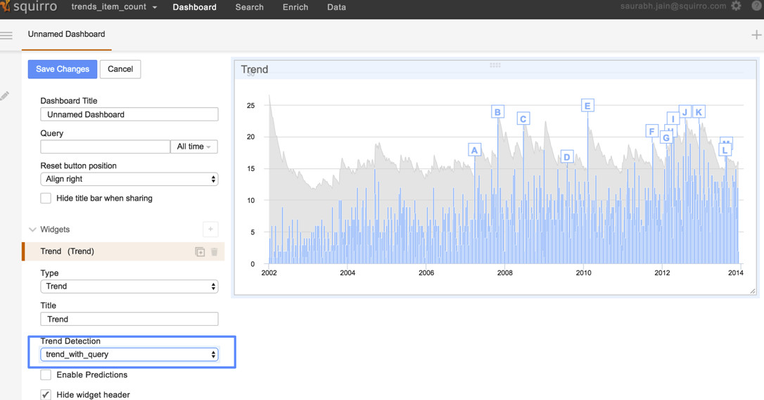
Visualize in Dashboard
Back on the dashboard, add or edit a Trend widget. The new trend detection is now available in the dropdown:
Scenario 2 - Trend Detection on numerical facets
Importing data into Squirro Project
This scenario uses a different data file which contains the number of incidents as a separate keyword. So instead of analyzing the number of results that have been indexed, there is now only one Squirro item for each day. But that item contains structured information about how many service tickers there were on this day.
- Download the CSV file: trends_tutorial_scenario2_dataset.csv.
- Create a new Squirro project. Make sure you select the option to create a project-specific index.
- One of the facets we import is going to be numeric. This needs to be configured before the import itself.
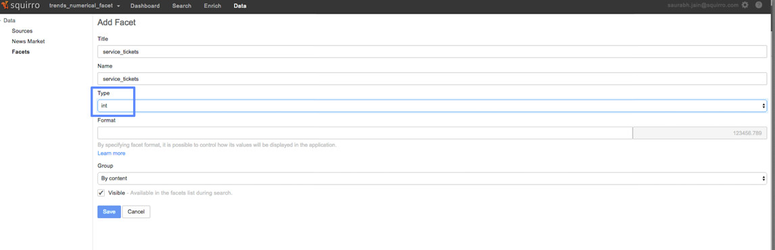
- On the "Data" tab select the "Facets" option from the left navigation.
- Click "Add Facet".
- As the Name enter "service_tickets" and select the Type int:
- Go back to the "Sources" section. Use the "CSV/Excel one-off import" to import the provided CSV file.
- The field mappings can again be left to their default.
Configure Trend Detection
Once the import has finished, you will see in the "Search" area that the number of results is flat. For each week there are seven items in the index. To quickly visualize the numerical facet you could add a Line Chart widget on the dashboard.
Instead of that, we will create a trend on the facet right away and visualize that.
- Select the "Create Trend" option from the "Save" dropdown.
- Because this project contains numerical facets, there is now a new checkbox "Numerical Aggregation". Select this checkbox.
- Select the numerical facet "service_tickets" and ensure the aggregation method is set to "Average".
- Use a daily aggregation interval.
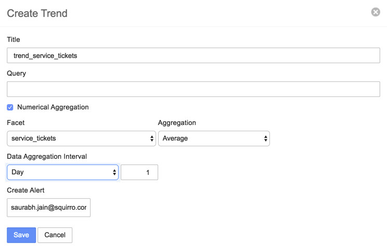
- Save that Trend Detection by pressing the "Save" button.
Visualize in Dashboard
After setting up the Trend Detection, you can now use it in the dashboard to visualize the data.
- Create a new Dashboard.
- Edit the default widget to be of type "Trend".
- Select the configured trend in the dropdown.
- Save the dashboard.
This results in a visualization on the number of service tickets.
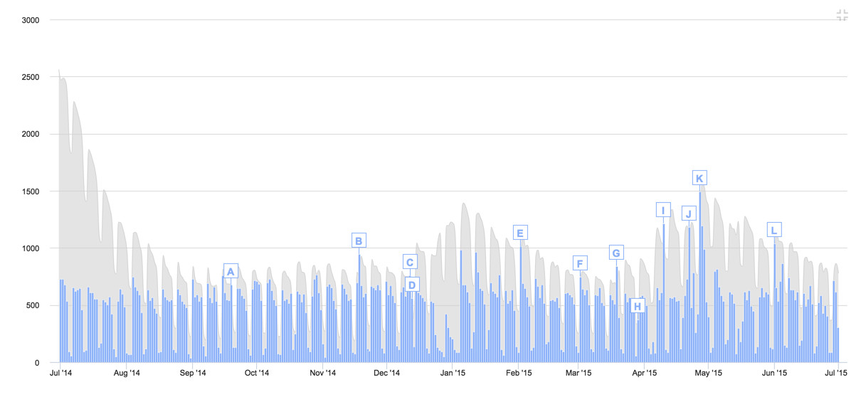
An interesting anomaly is the one that has been flagged with the letter "H" in the screenshot. It is far lower than for example the day immediately after it. But when you hover over it, you will see that it falls on a Sunday. And because Sundays usually have a lot fewer incidents than other days, this results in a detected anomaly.
Predict the Future
This time series has very recognizable repeating patterns - so-called seasonality. The future values of such time series can be predicted and visualized as well. In order to turn on the predictions visualization, go to the edit mode of the "Trends" widget and check the "Enable Predictions" checkbox.
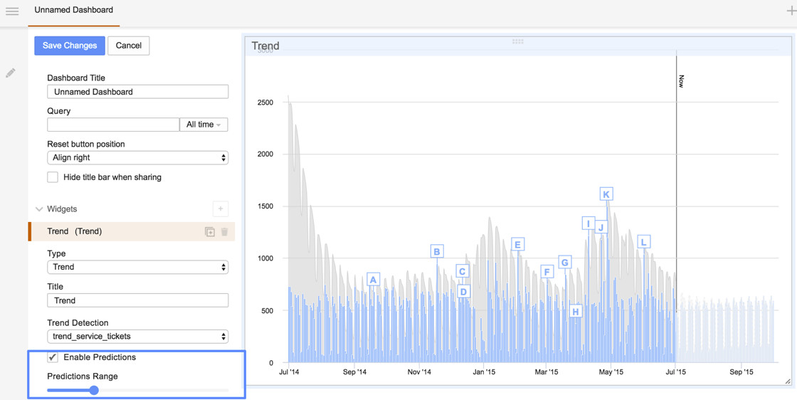
After checking the "Enable Predictions" check-box, the Trends widget will be updated with the future predictions of the time series data based on the repeating patterns recognized by Squirro in the historical data. Moreover, the number of future predictions being displayed can be adjusted using the "Predictions Range" slider.
Conclusion
The two examples in this tutorial led you through two main scenarios for using Trend-Detection
- Setting up Trend Detection on the item counts over time in a Squirro project.
- Setting up Trend Detection on the values of numerical facets over time in a Squirro project.
Consult the Trend Detection reference for reference or contact support if you have any questions about how to do something specific with the Trend Detection.