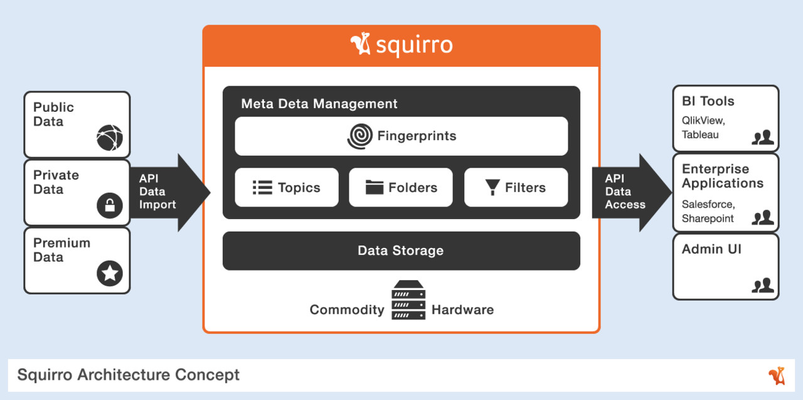
The Squirro platform is able to work with various data sources. You can create smart filterss from reference documents that are external (e.g. Wikipedia article) or internal (e.g. specific source documents). Smart filters describe a specific theme. Once defined, smart filters are used to analyze the unstructured textual parts of any source document. After analysis, the source data can be embedded in any business intelligence tool or enterprise application for consumption by end users. All data import and data access is performed through a single API.
4.1. About Smart Filters
A Smart Filter is a topical theme that is used to filter and discover data using associated textual features (that identify underlying concepts or ideas). A Smart Filter can be used across many data sources and dashboards.
4.2. Create a Smart Filter
Smart Filter creation is often where developers need the most help, because this process occurs completely outside of the regular QlikView environment. However, this is also where the tools for the unstructured text analysis are prepared. Every Smart Filter maps to an underlying concept that may be analysed or visualised.
You can create a Smart Filter by providing one or more reference documents stored within Squirro, such as external documents (e.g. Wikipedia articles, job descriptions, etc.), or indexed source data items (e.g. news articles, bug reports, job profiles, etc.). Once created, smart filers can be re-used.
4.2.1. Creating from External Reference Documents
In this section, you create a Smart Filter from an external reference document. The first two paragraphs of the English Wikipedia article on Memory Leak are used. The Smart Filter is titled “Memory Leak”.
- Go to the Squirro Administrative UI.
- Click Settings then select Smart Filters.
- Click Create Smart Filter.
- Specify the following properties:
- Title
- Name (optional, completed from the title)
- Tags (optional, used to export scores for multiple Smart Filters)
- Content
- Content Language
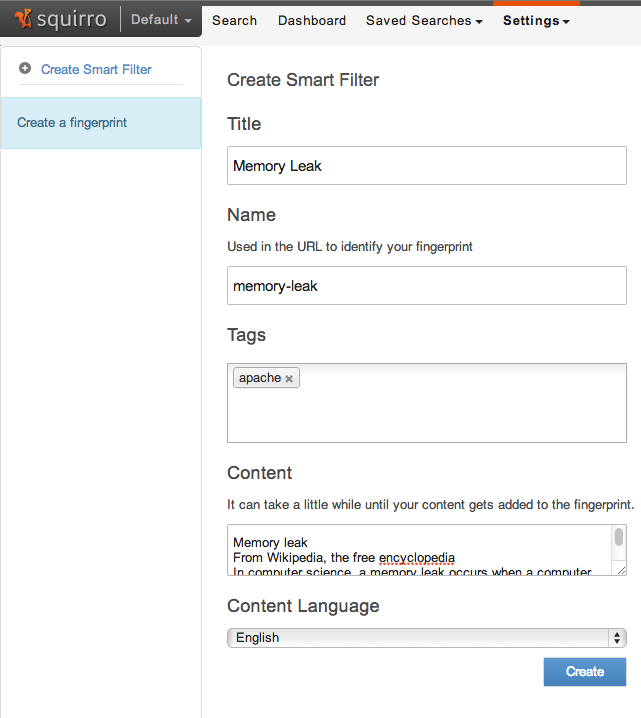
- Click Create.
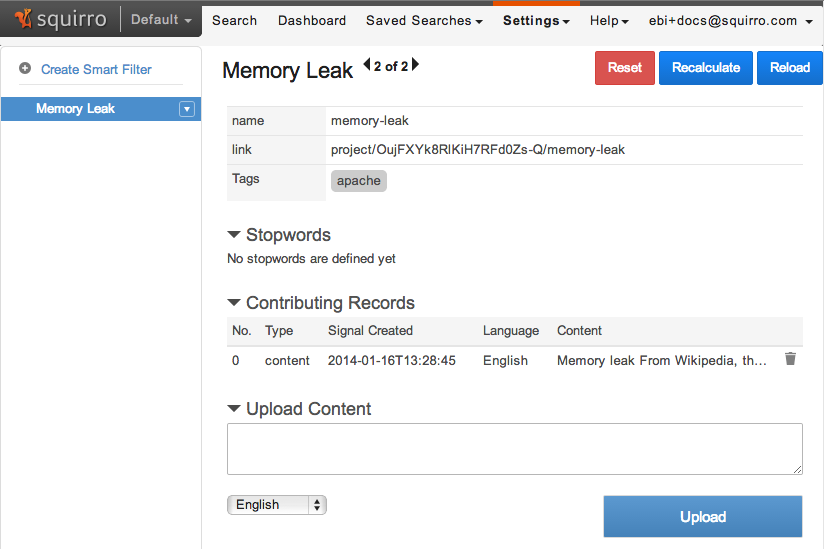
- Click Reload.
List of displayed fields:
- Title
- Name
- Modified At
- Link
- Contributing Records
- Upload Content
- Content
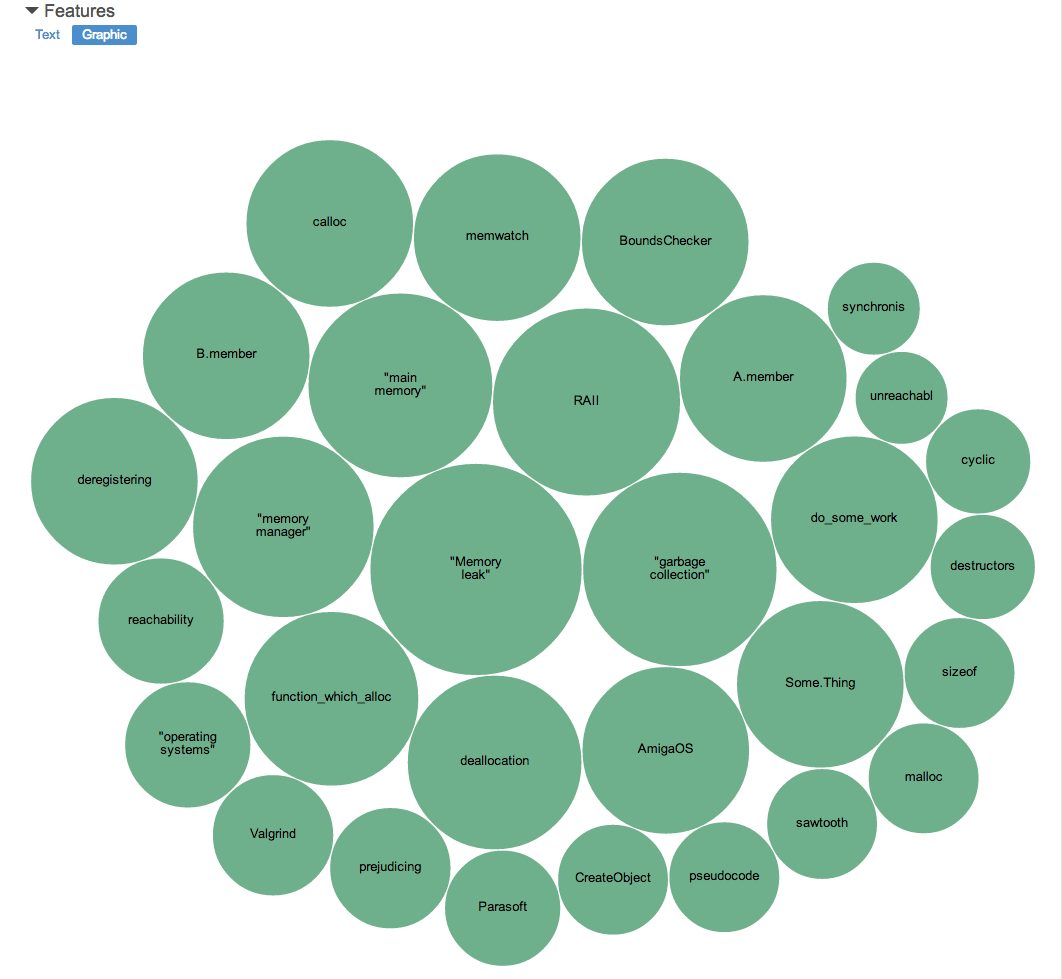
Smart Filter features representation in tabular format:
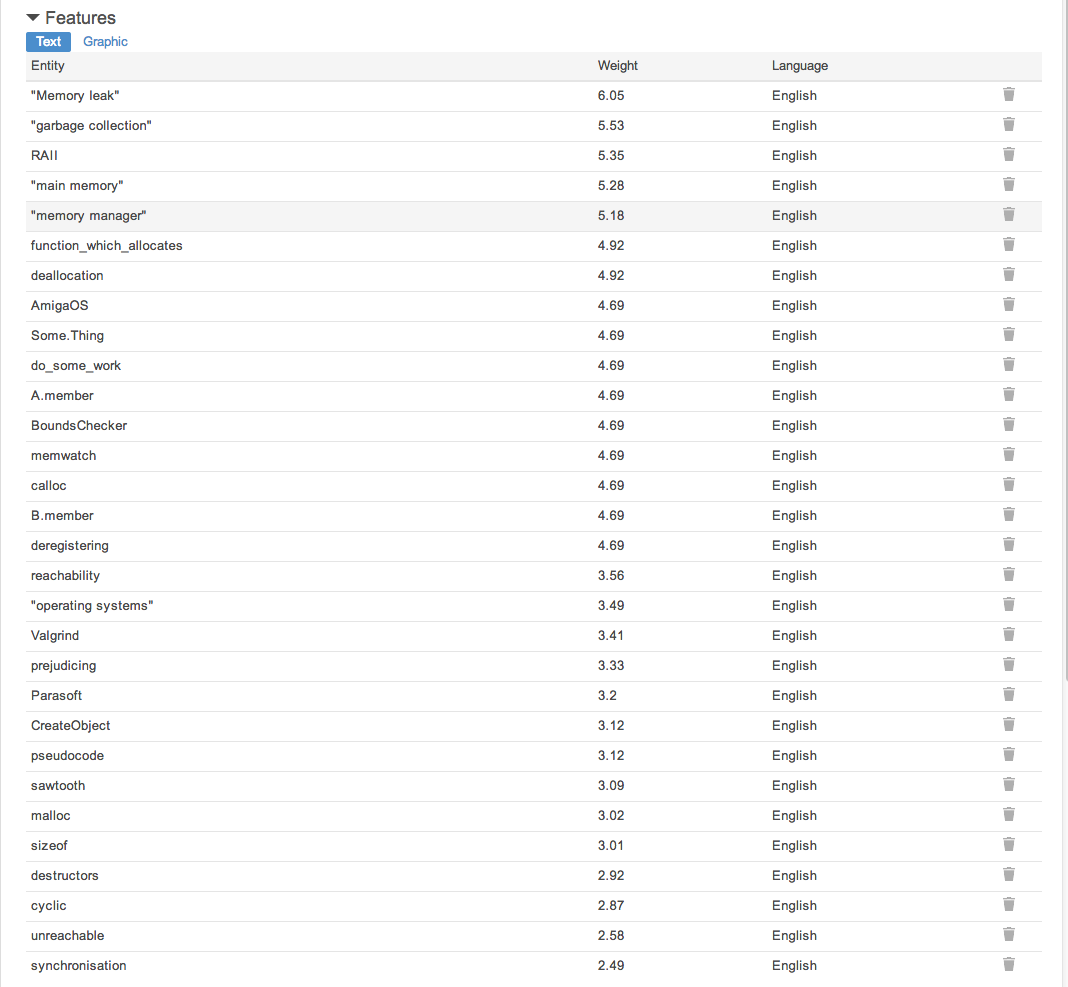
Smart Filter features representation in graphical format:
4.2.2. Creating from Indexed Documents
In this section, you create a Smart Filter from indexed documents. You begin by locating a reference document with the help of a Boolean search query and create a Smart Filter from it.
Go to the Squirro Administrative UI.
Locate the reference document by using Squirro’s powerful fulltext search capabilities (e.g. by using Boolean algebra to formulate queries).
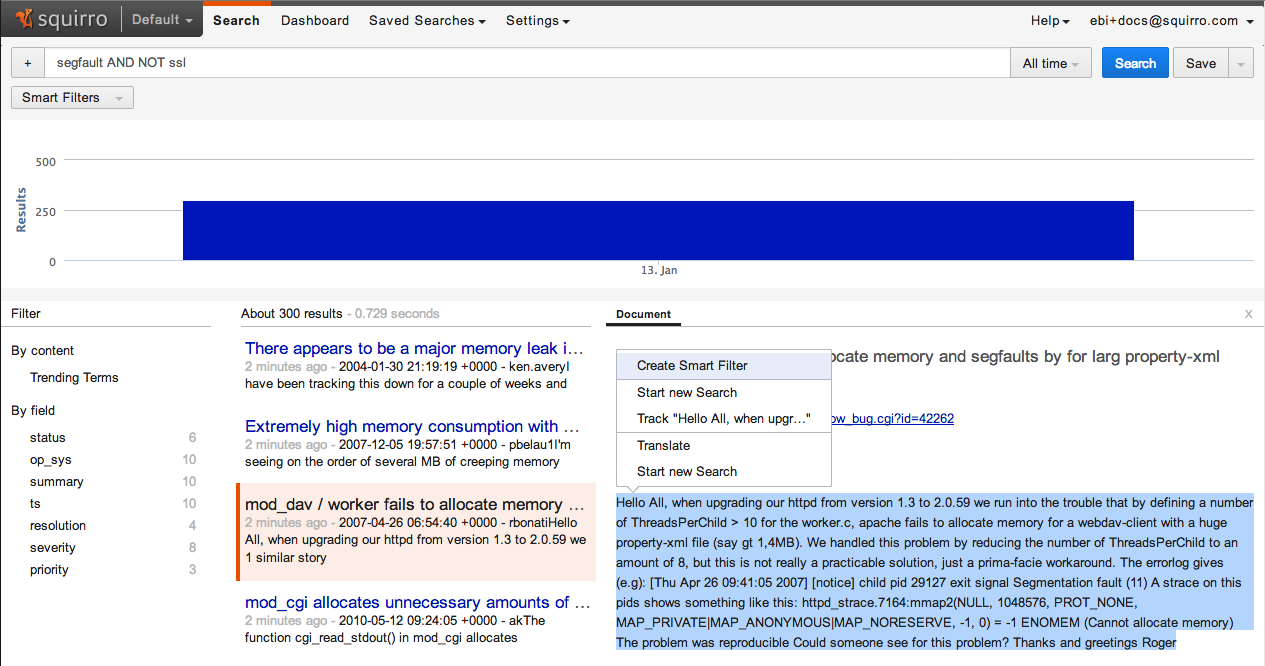
The actual search query used is
segfault AND NOT ssl.Select some text for creating the Smart Filter. The context menu now shows up.
Select Create Smartfilter
Click on the newly created Smart Filter 1.
Click Edit.
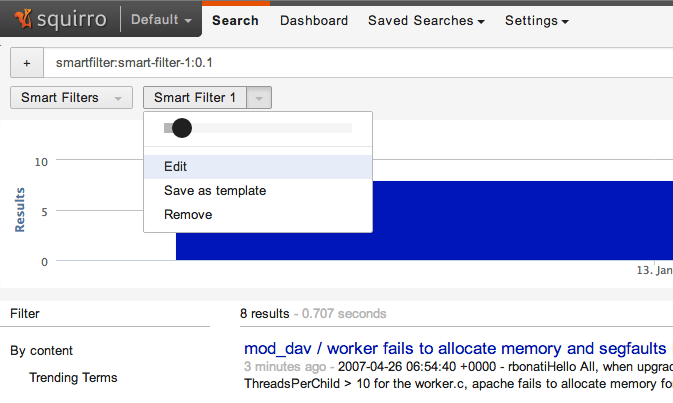
You see the contents of the Smart Filter and can refine it by uploading or removing content.
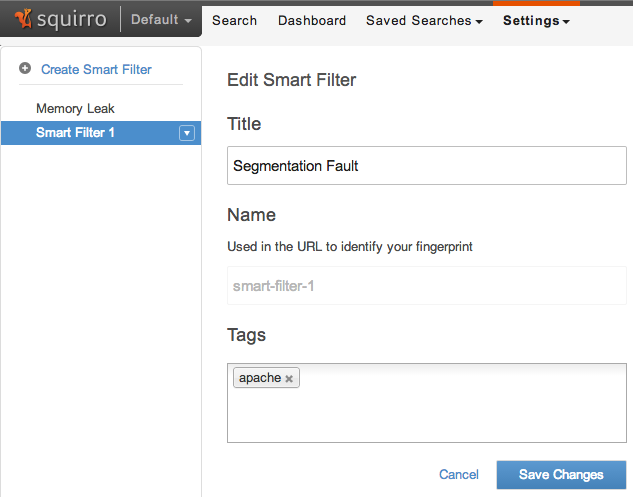
Click on the arrow next to the Smart Filter in the navigation.
Click Edit.
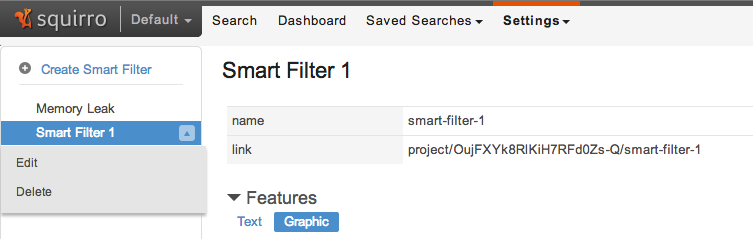
Change the title to
Segmentation FaultClick Save Changes.
4.3. Using a Smart Filter for Item Filtering
Once a Smart Filter has been created, you can use it in the Squirro Administrative UI to filter the number of items displayed in a project. Use facets to filter based on structured (e.g. item priority) and unstructured (e.g. memory leak Smart Filter) item content.
Click the Smart Filters button and select the Smart Filter to apply to the search.
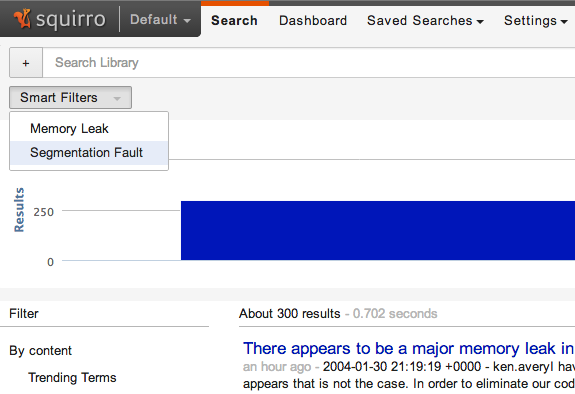
Click the Memory Leak button and adjust the noise level
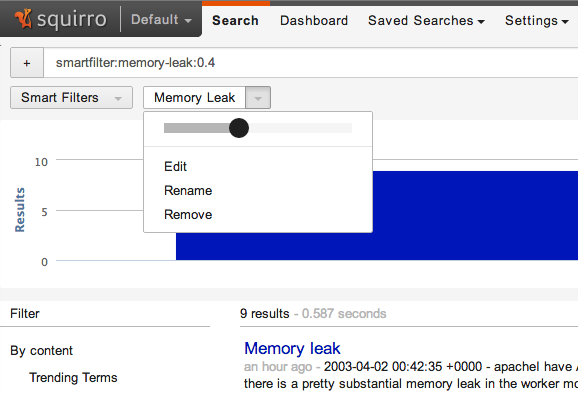
The selected Smart Filter has been added as a filter on the search. Only items associated with that Smart Filter are displayed.
4.4. Export Smart Filter Noise Levels
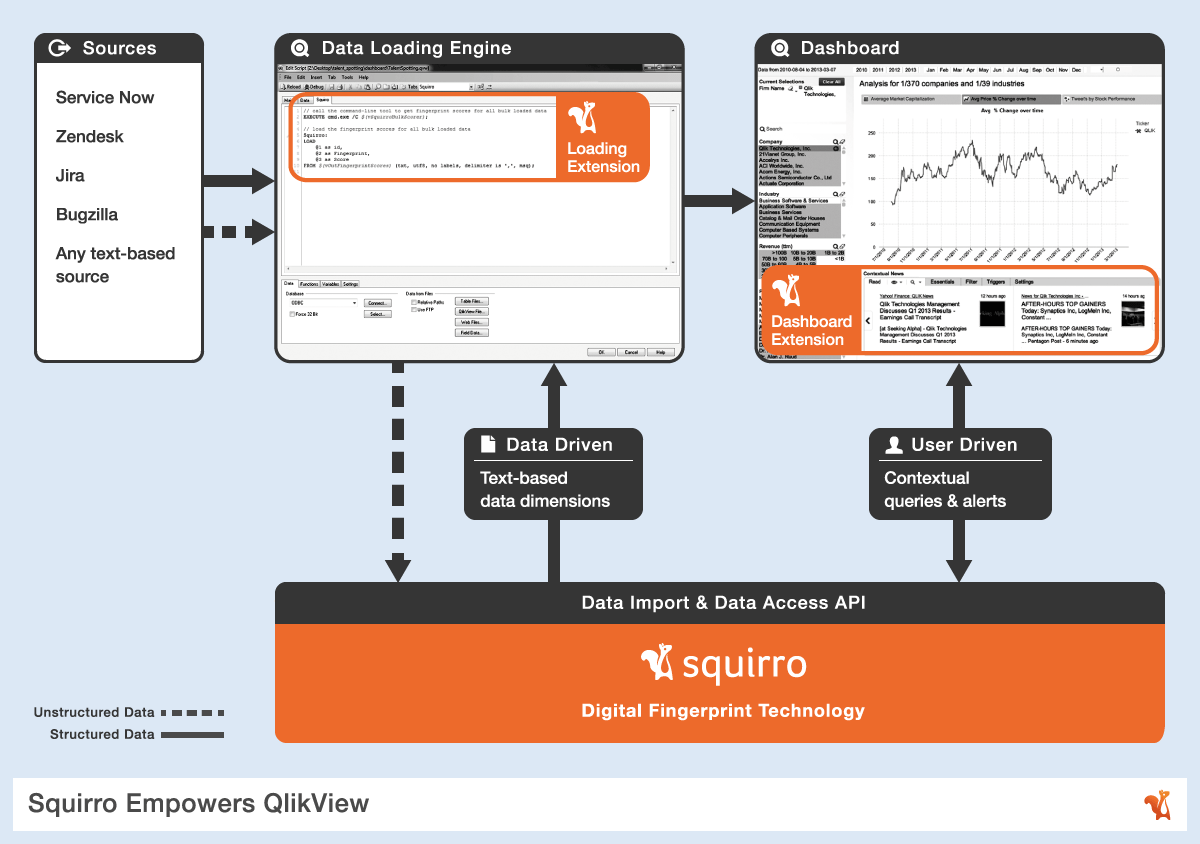
The QlikView data loading engine is used to access source system data. There are two command-line tools:
squirro_bulk_loader: Enhances a load script by forwarding unstructured textual data in bulk into Squirro.squirro_bulk_scorer: Retrieves the text-based data dimensions and exports noise levels for a set of items (e.g. a project) and a set of Smart Filters identified by tags.
The QlikView dashboard visualizes all input data and allows for the combination of structured (e.g. ticket priority) and unstructured (e.g. Smart Filter) data dimensions. Source documents are put in context into an existing dashboard with an iFrame extension that queries the Squirro platform based on user interaction.
4.4.1. Export a Smart Filter into QlikView
Once built, a Smart Filter can be used to rate individual source documents. The rating results in a score that can be exported for re-use. The score is a similarity measure that indicates how close a given document is to the concept of the Smart Filter. The scores are attributed a noise level ranging from 0.0 (meaning only the items closest to the concept are visible) to 1.0 (meaning all items are visible). You can embed the noise levels into any QlikView dashboard as an independent dimension that can be used for data discovery on structured as well as unstructured data.
In the QlikView dashboard, you can use the bulk scoring tool to connect to the Squirro platform and recalculate all the scores and corresponding noise levels for all available Smart Filters for each and every source record that has been indexed. You can calculate the noise level for individual Smart Filters.
4.4.2. Modify the QlikView Load Script
In an editor, open the
LoadScripts\03_squirro.txtfile.Uncomment the command line execution and the loading of the resulting .csv file:
// call the command-line tool to get Smart Filter noise levels for all
// bulk loaded data
EXECUTE cmd.exe /C $(vSquirroBulkScorer);

// load the Smart Filter noise levels for all bulk loaded data
Squirro:
LOAD
    @1 as id,
    @2 as SmartFilter,
    @3 as NoiseLevel
FROM $(vOutSmartFilterScores) (txt, utf8, no labels, delimiter is ',', msq);
Notice how the bulk scoring tool uses the tag “apache” to select Smart Filters for score calculation. Multiple filters can be tagged.
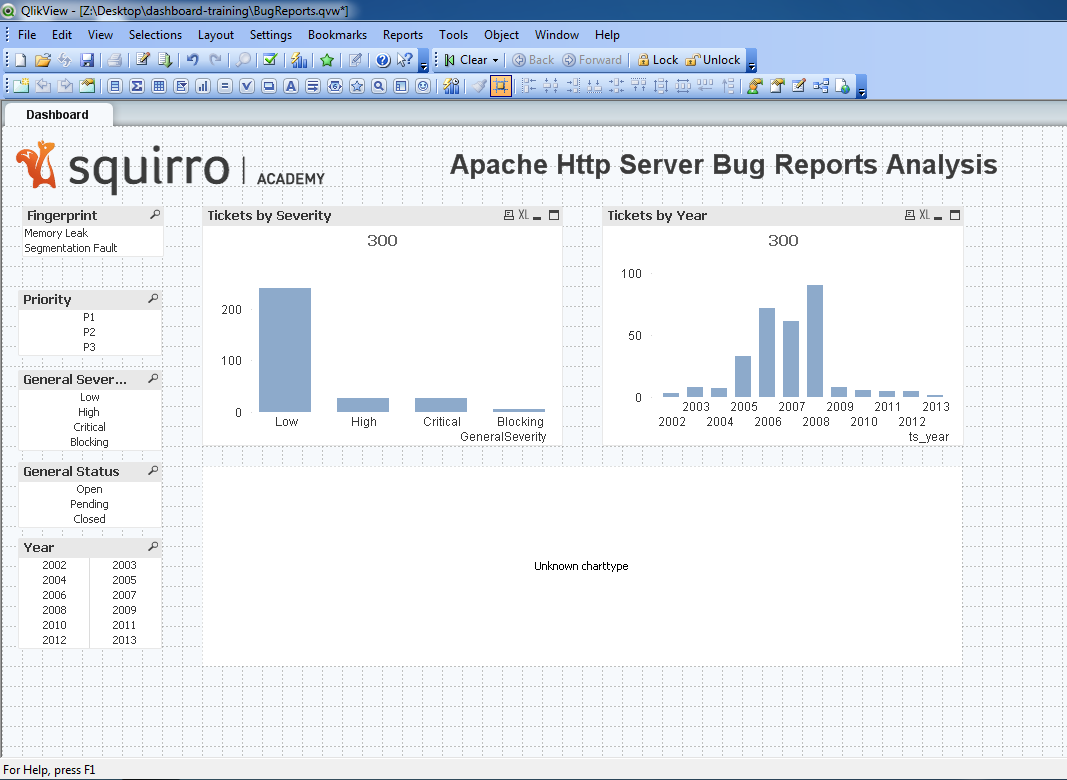
Choose File -> Reload from the menu to reload the dashboard. QlikView will display a security warning.
Notice how a new data dimension (based on textual analysis) has become available.
4.4.3. Add the Smart Filter Dimension
In QlikView, choose Layout -> Select Fields from the menu.
From the available fields, select the SmartFilter field...
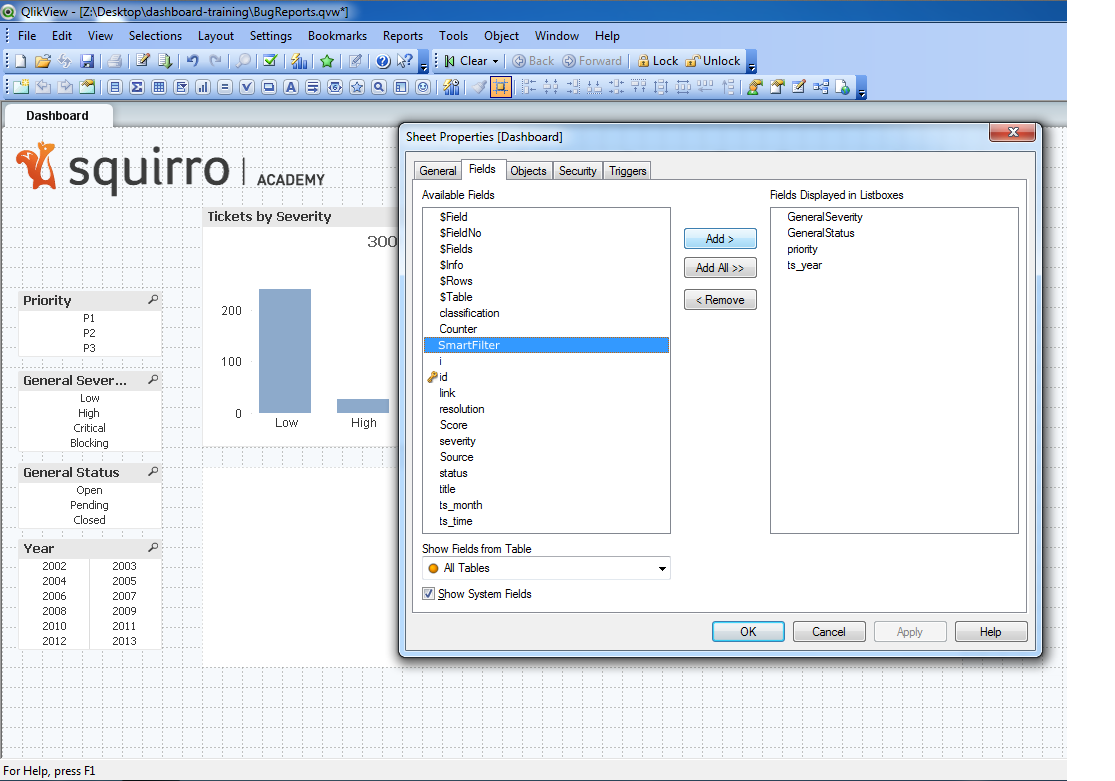
Place the Smart Filter dimension list box on the dashboard.
4.5. Configure Item Filtering
Next, configure the extension so that any user selection gets forwarded from QlikView to the extension object. This tutorial uses expressions to build a Squirro-compatible query (see Item Filtering to get started). The expressions are defined in LoadScripts\04_filters.txt. At this point, you can conditionally filter items, depending on whether a Smart Filter is selected in the dashboard.
Ticket ID Filter
For the selected Smart Filter, all ticket identifiers that have a noise level below the defined threshold (custom for every project, stored in the variable $vThreshold):
// ticket id filter
SET vTicketFilter =
    left(concat({$<NoiseLevel={'<=$(vThreshold)'}>} distinct 'i:' & id, ' OR ', NoiseLevel), if(substringcount(concat({$<NoiseLevel={'<=$(vThreshold)'}>} distinct 'i:' & id, ' OR ', NoiseLevel), ' OR ')<100,len(concat({$<NoiseLevel={'<=$(vThreshold)'}>} distinct 'i:' & id, ' OR ', NoiseLevel)), index(concat({$<NoiseLevel={'<=$(vThreshold)'}>} distinct 'i:' & id, ' OR ', NoiseLevel), ' OR ', 100) - 1));
Query Filter
All the individual filter expressions above are tied together as a query filter:
// query filter with Smart Filter selector
SET vQueryAdv =

    if (GetSelectedCount(SmartFilter) > 0,

        // item filtering by ticket identifier, only choose the top 100
        $(vTicketFilter),

        // item filtering by dimensions
        if (Len($(vPriorityFilter)) > 0, $(vPriorityFilter)) &
        if (Len($(vPriorityFilter)) > 0 AND (Len($(vSeverityFilter)) > 0 OR Len($(vStatusFilter)) > 0), ' AND ') &
        if (Len($(vSeverityFilter)) > 0, $(vSeverityFilter)) &
        if (Len($(vSeverityFilter)) > 0 AND Len($(vStatusFilter)) > 0, ' AND ') &
        if (Len($(vStatusFilter)) > 0, $(vStatusFilter))
    );
Change the Filter Query
In the Squirro extension properties dialog, open the Item Filtering tab, and change the following setting:
- Query: Set to
=$(vQueryAdv).
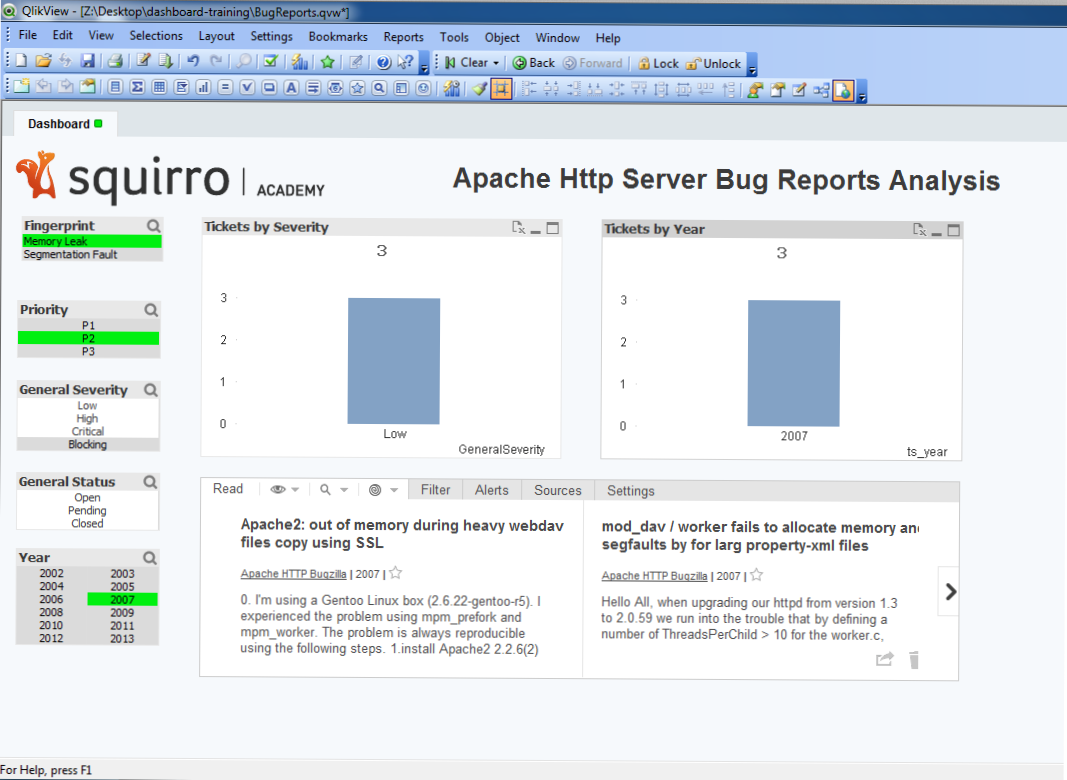
4.6. Final Dashboard
After the extension has been configured to forward any user selection from QlikView to the extension object, the dashboard is ready for use. As soon as a selection is changed, notice that the extension displays only the applicable bug reports.
Next: 5. Next Steps