...
The jaeger GUI now is available at http://127.0.0.1:16686
Find most time consuming component in a request
If a squirro request is slow (e.g query a result), you can investigate which component take time by using parameter &timing=true in the request to see detail time report of the request.
To investigate squirro request, from your browser, open menu Tools-Web Developer -Network (Firefox) or View-Developer-Developer Tools (Chrome), and submit query again. You should see the request in the developer tool:
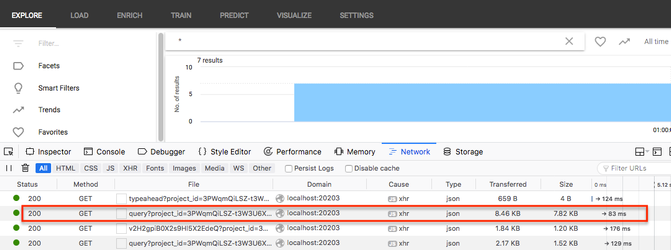
copy this request, add &timing=true&token={your_squirro_token}, and put it on address bar of browser to get the response.
The timing report should be look like below, time_took_ms is execution of each component and time_ms is total execution time. If you suspect Elasticsearch request is slow, look at the node Elasticsearch\/squirro... in the response to see how long it took.
| Code Block |
|---|
{
    ...
    "timing_report":{
        "wrapped_f":{
            "start_time":1518611439.118776083,
            "_validate_request_params":{
                "time_took_ms":0,
                "start_time":1518611439.1258709431
            },
            "time_took_ms":36,
            ...
            "_run_query_with":{
                "time_took_ms":20,
                ...
                "read_items_by":{
                    "time_took_ms":18,
                    "_do_read_items_by":{
                        ...
                        "_read_items_by_query":{
                            "time_took_ms":11,
                            "start_time":1518611439.141078949,
                            "_execute_query":{
                                "Elasticsearch\/squirro_v8_3pwqmqilsz-t3w3u6xts1q\/item\/_search":{
                                    "time_took_ms":8,
                                    "start_time":1518611439.1428649426
                                },
                                "time_took_ms":10,
                                "start_time":1518611439.1418509483,
                                "_cache_if_result_not_empty_on_timeout":{
                                    "time_took_ms":0,
                                    "start_time":1518611439.1512749195
                                },
          						...
                            }
                        },
                        ...
                    },
                    "start_time":1518611439.1355009079,
                    "_validate_params":{
                        "time_took_ms":0,
                        "start_time":1518611439.1356248856
                    }
                }
            },
            "_get_query_params":{
                "time_took_ms":7,
                "_expand_all_aggregations":{
                    "time_took_ms":0,
                    "start_time":1518611439.1336150169
                },
                "start_time":1518611439.1260149479
            }
        }
    },
    "time_ms":40,
    "total":7
} |